Twisted Forex's Doji + Area StrategyTitle
Twisted Forex’s Doji + Area Strategy
Description
What this strategy does
This strategy looks for doji candles forming inside or near supply/demand areas . Areas are built from swing pivots and sized with ATR, then tracked for retests (“confirmations”). When a doji prints close to an area and quality checks pass, the strategy places a trade with the stop beyond the doji and a configurable R:R target.
How areas (zones) are built
• Swings are detected with a user-set pivot length.
• Each swing spawns a horizontal area centered at the pivot price with half-height = zoneHalfATR × ATR .
• Duplicates are de-duplicated by center distance (ATR-scaled).
• Areas fade when broken beyond a buffer or after an optional age (expiry).
• Retests are recorded when price touches and then bounces away from the area; repeated reactions increase the zone’s “strength”.
Signal logic (summary)
Doji detection: strict or loose body criteria with optional minimum wick fractions and ATR-scaled minimum range.
Proximity: price must be inside/near a supply or demand area (proxATR × ATR).
Side resolution: overlap is resolved by (a) which side price penetrates more, (b) fast/slow EMA trend, or (c) nearest distance. Optional “previous candle flip” can bias long after a bearish candle and short after a bullish one.
Optional 1-bar confirmation: the bar after the doji must close away from the area by confirmATR × ATR .
Quality filter (Off/Soft/Strict): four checks—(i) wick rejection past the edge, (ii) doji closes in an edge “band” of the area, (iii) fresh touch (cooldown), (iv) approach impulse over a short lookback. In Strict , thresholds auto-tighten.
Orders & exits
• Long: stop below doji low minus buffer; Short: above doji high plus buffer.
• Target = rrMultiple × risk distance .
• Pyramiding is off by default.
Position sizing
You can size from the script or from Strategy Properties:
• Script-driven (default): set Position sizing = “Risk % of equity” and choose riskPercent (e.g., 1.0%). The script applies safe floors/rounding (FX micro-lots by default) so quantity never rounds to zero.
• Properties-driven : toggle Use TV Properties → Order size ON, then pick “Percent of equity” in Properties (e.g., 1%). The header includes safe defaults so trades still place.
Key inputs to explore
• Zone building : pivotLen, zoneHalfATR, minDepartureATR, expiryBars, breakATR, leftBars, dedupeATR.
• Doji & proximity : strictDoji, dojiBodyFrac, minWickFrac, minRangeATR, proxATR, minBarsBetween.
• Overlap resolution : usePenetration, useTrend (EMA 21/55), “previous candle flip”, needNextBarConf & confirmATR.
• Quality : qualityMode (Off/Soft/Strict), minQualPass/kStrict, wickPenATR, edgeBandFrac, approachLookback, approachMinATR, freshTouchBars.
• Zone strength gating : minStrengthSoft / minStrengthStrict.
• HTF confluence (optional) : useHTFTrend (HTF EMA 34/89) and/or useHTFZoneProx (HTF swing bands).
Tips to make it cleaner / higher quality
• Turn needNextBarConf ON and use confirmATR = 0.10–0.15 .
• Increase approachMinATR (e.g., 0.35–0.45) to require a stronger pre-touch impulse.
• Raise minStrengthSoft/Strict (e.g., 4–6) so only well-reacted zones can signal.
• Use signalsOnlyConfirmed ON if you prefer trades only from zones with retests (the script falls back gracefully when none exist yet).
• Nudge proxATR to 0.5–0.6 to demand tighter proximity to the level.
• Optional: enable useHTFTrend to filter counter-trend setups.
Default settings used in this publication
• Initial capital: 100,000 (illustrative).
• Slippage: 1 tick; Commission: 0% (you can raise commission if you prefer—spread is partly modeled by slippage).
• Sizing: Risk % of equity via inputs; riskPercent = 1.0% ; FX uses micro-lot floors by default.
• Quality: Off by default (Soft/Strict available).
• HTF trend gate: Off by default.
Backtesting notes
For a meaningful sample size, test on liquid symbols/timeframes that yield 100+ trades (e.g., majors on 5–15m over 1–2 years). Backtests are modelled and broker costs/spread vary—validate on your feed and forward-test.
How to read the chart
Shaded bands are supply (above) and demand (below). Brighter bands are the nearest K per side (visual aid). BUY/SELL labels mark entries; colored dots show entry/SL/TP levels. You can hide zones or unconfirmed zones for a cleaner view.
Disclaimer
This is educational material, not financial advice. Trading involves risk. Always test and size responsibly.
Cari dalam skrip untuk "the script"

Dynamic Swing Anchored VWAP STRAT (Zeiierman/PineIndicators)Dynamic Swing Anchored VWAP STRATEGY — Zeiierman × PineIndicators (Pine Script v6)
A pivot-to-pivot Anchored VWAP strategy that adapts to volatility, enters long on bullish structure, and closes on bearish structure. Built for TradingView in Pine Script v6.
Full credits to zeiierman.
Repainting notice: The original indicator logic is repainting. Swing labels (HH/HL/LH/LL) are finalized after enough bars have printed, so labels do not occur in real time. It is not possible to execute at historical label points. Treat results as educational and validate with Bar Replay and paper trading before considering any discretionary use.
Concept
The script identifies swing highs/lows over a user-defined lookback ( Swing Period ). When structure flips (most recent swing low is newer than the most recent swing high, or vice versa), a new regime begins.
At each confirmed pivot, a fresh Anchored VWAP segment is started and updated bar-by-bar using an EWMA-style decay on price×volume and volume.
Responsiveness is controlled by Adaptive Price Tracking (APT) . Optionally, APT auto-adjusts with an ATR ratio so that high volatility accelerates responsiveness and low volatility smooths it.
Longs are opened/held in bullish regimes and closed when the regime turns bearish. No short positions are taken by design.
How it works (under the hood)
Swing detection: Uses ta.highestbars / ta.lowestbars over prd to update swing highs (ph) and lows (pl), plus their bar indices (phL, plL).
Regime logic: If phL > plL → bullish regime; else → bearish regime. A change in this condition triggers a re-anchor of the VWAP at the newest pivot.
Adaptive VWAP math: APT is converted to an exponential decay factor ( alphaFromAPT ), then applied to running sums of price×volume and volume, producing the current VWAP estimate.
Rendering: Each pivot-anchored VWAP segment is drawn as a polyline and color-coded by regime. Optional structure labels (HH/HL/LH/LL) annotate the swing character.
Orders: On bullish flips, strategy.entry("L") opens/maintains a long; on bearish flips, strategy.close("L") exits.
Inputs & controls
Swing Period (prd) — Higher values identify larger, slower swings; lower values catch more frequent pivots but add noise.
Adaptive Price Tracking (APT) — Governs the VWAP’s “half-life.” Smaller APT → faster/closer to price; larger APT → smoother/stabler.
Adapt APT by ATR ratio — When enabled, APT scales with volatility so the VWAP speeds up in turbulent markets and slows down in quiet markets.
Volatility Bias — Tunes the strength of APT’s response to volatility (above 1 = stronger effect; below 1 = milder).
Style settings — Colors for swing labels and VWAP segments, plus line width for visibility.
Trade logic summary
Entry: Long when the swing structure turns bullish (latest swing low is more recent than the last swing high).
Exit: Close the long when structure turns bearish.
Position size: qty = strategy.equity / close × 5 (dynamic sizing; scales with account equity and instrument price). Consider reducing the multiplier for a more conservative profile.
Recommended workflow
Apply to instruments with reliable volume (equities, futures, crypto; FX tick volume can work but varies by broker).
Start on your preferred timeframe. Intraday often benefits from smaller APT (more reactive); higher timeframes may prefer larger APT (smoother).
Begin with defaults ( prd=50, APT=20 ); then toggle “Adapt by ATR” and vary Volatility Bias to observe how segments tighten/loosen.
Use Bar Replay to watch how pivots confirm and how the strategy re-anchors VWAP at those confirmations.
Layer your own risk rules (stops/targets, max position cap, session filters) before any discretionary use.
Practical tips
Context filter: Consider combining with a higher-timeframe bias (e.g., daily trend) and using this strategy as an entry timing layer.
First pivot preference: Some traders prefer only the first bullish pivot after a bearish regime (and vice versa) to reduce whipsaw in choppy ranges.
Deviations: You can add VWAP deviation bands to pre-plan partial exits or re-entries on mean-reversion pulls.
Sessions: Session-based filters (RTH vs. ETH) can materially change behavior on futures and equities.
Extending the script (ideas)
Add stops/targets (e.g., ATR stop below last swing low; partial profits at k×VWAP deviation).
Introduce mirrored short logic for two-sided testing.
Include alert conditions for regime flips or for price-VWAP interactions.
Incorporate HTF confirmation (e.g., only long when daily VWAP slope ≥ 0).
Throttle entries (e.g., once per regime flip) to avoid over-trading in ranges.
Known limitations
Repainting: Swing labels and pivot confirmations depend on future bars; historical labels can look “perfect.” Treat them as annotations, not executable signals.
Execution realism: Strategy includes commission and slippage fields, yet actual fills differ by venue/liquidity.
No guarantees: Past behavior does not imply future results. This publication is for research/education only and not financial advice.
Defaults (backtest environment)
Initial capital: 10,000
Commission value: 0.01
Slippage: 1
Overlay: true
Max bars back: 5000; Max labels/polylines set for deep swing histories
Quick checklist
Add to chart and verify that the instrument has volume.
Use defaults, then tune APT and Volatility Bias with/without ATR adaptation.
Observe how each pivot re-anchors VWAP and how regime flips drive entries/exits.
Paper trade across several symbols/timeframes before any discretionary decisions.
Attribution & license
Original indicator concept and logic: Zeiierman — please credit the author.
Strategy wrapper and publication: PineIndicators .
License: CC BY-NC-SA 4.0 (Attribution-NonCommercial-ShareAlike). Respect the license when forking or publishing derivatives.

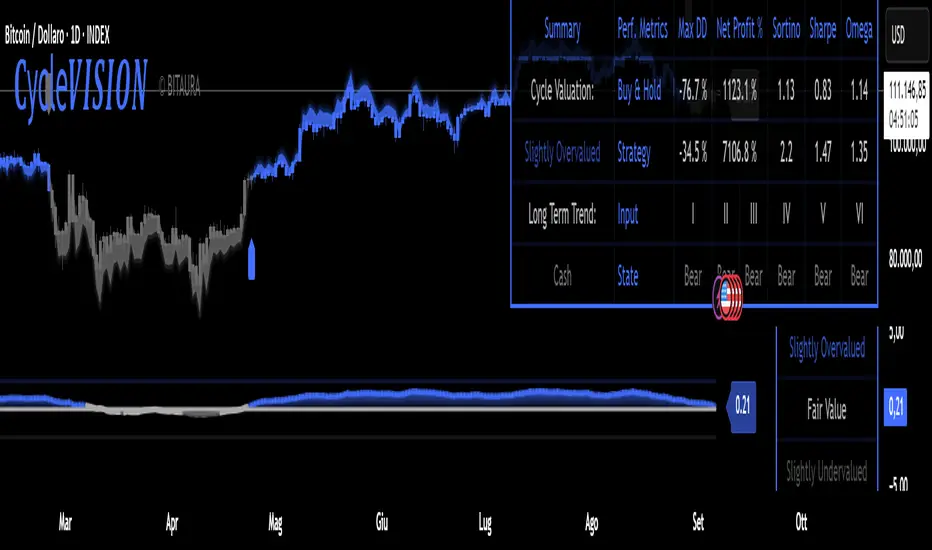
CycleVISION [BitAura]𝐂ycle𝑽𝑰𝑺𝑰𝑶𝑵
This Pine Script® indicator combines a long-term trend-following strategy with a cycle valuation Z-score analysis to generate a Trend Probability Indicator (TPI). The TPI aggregates signals from multiple trend and on-chain metrics to identify optimal entry and exit points for a single asset, with USD as a cash position. The system also calculates a comprehensive Z-score based on performance and valuation metrics to assess market cycles, aiming to enhance risk-adjusted returns for long-term investors.
Logic and Core Concepts
The 𝐂ycle𝑽𝑰𝑺𝑰𝑶𝑵 System uses two primary components to guide investing decisions:
1. Trend Probability Indicator (TPI)
Mechanism : Aggregates five proprietary, universal, trend signals and three on-chain metrics into a composite TPI score, normalized between -1 and 1.
Thresholds : Enters a long position when the TPI score exceeds a user-defined long threshold (default: 0.0) and exits to cash when it falls below a short threshold (default: -0.5).
Execution : Trades are executed only on confirmed bars within a user-specified backtest date range, ensuring robust signal reliability.
2. Cycle Valuation Z-Score
Mechanism : Computes an average Z-score from six metrics: Sharpe Ratio, Sortino Ratio, Omega Ratio, Weekly RSI, Crosby Ratio, and Price Z-Score, using a 1200-bar lookback period.
Purpose : Identifies overvalued or undervalued market conditions to complement TPI signals, with thresholds at ±1.8 for extreme valuations.
Visualization : Displays the average Z-score and individual components, with gradient-based bar coloring to reflect valuation strength.
Features
Dynamic Trend Signals : Combines trend and on-chain data into a single TPI score for clear long/cash decisions.
Comprehensive Valuation : Calculates Z-scores for multiple performance and price metrics to assess market cycles.
Customizable Inputs : Allows users to adjust TPI thresholds, backtest date ranges, and valuation metrics visibility.
Visual Outputs :
Valuation Table : Displays TPI score, Z-scores, and performance metrics (Sharpe, Sortino, Omega, Max Drawdown, Net Profit) in a configurable table (Lite, Medium, Full).
Equity Curve : Plots the system’s equity curve compared to buy-and-hold performance.
Price and TPI Plot : Overlays TPI-adjusted price bands with glow effects and filled gaps for trend visualization on the price chart.
Valuation Coloring : Applies backgrounds based on Z-score ranges (e.g., strong buy above 1.8, strong sell below -1.8).
Configurable Alerts : Notifies users of TPI signal changes (Long to Cash or Cash to Long) with detailed messages.
Color Presets : Offers five color themes (e.g., Arctic Blast, Fire vs. Ice) or custom color options for long/short signals.
Pine Script v6 : Leverages matrices, tables, and gradient coloring for enhanced usability.
How to Use
Add to Chart : Apply the indicator to any chart (the chart’s ticker is used for calculations, e.g., INDEX:BTCUSD ).
Configure Settings : Adjust TPI thresholds, backtest start date (default: 01 Feb 2018), and valuation metrics visibility in the Inputs menu.
Select Color Theme : Choose a preset color mode (e.g., Arctic Blast) or enable custom colors in the Colors group.
Monitor Outputs : Check the Valuation Table for TPI and Z-score data, and view the Price and TPI Plot for trend signals.
Analyze Performance : Enable the equity curve and performance metrics in the Backtesting Options group to compare results.
Set Alerts : Right-click a plot, select "Add alert," and choose "Trend Change: Long to Cash" or "Trend Change: Cash to Long" for notifications.
The system is optimized for daily timeframe and tested across various assets to ensure robustness.
Notes
The script is closed-source.
Use a standard price series (not Heikin Ashi or other non-standard types) for accurate results.
The script avoids lookahead bias by using barmerge.lookahead_off in request.security() calls.
A minimum 1200-bar lookback is mandatory for Z-score calculations to avoid errors, with warnings displayed if insufficient price history is available.
The BitAura watermark can be toggled in the Table Settings group.
Disclaimer : This script is for educational and analytical purposes only and does not constitute financial advice. Trading involves significant risk, and past performance is not indicative of future results. Always conduct your own research and apply proper risk management.
Trend MasterOverview
The Strategy is a trend-following trading system designed for forex, stocks, or other markets on TradingView. It uses pivot points to identify support and resistance levels, combined with a 200-period Exponential Moving Average (EMA) to filter trades. The strategy enters long or short positions based on trend reversals during specific trading sessions (London or New York). It incorporates robust risk management, including position sizing based on risk percentage or fixed amount, trailing stop-losses, breakeven moves, and weekly/monthly profit/loss limits to prevent overtrading.
This script is ideal for traders who want a semi-automated approach with visual aids like colored session backgrounds, support/resistance lines, and a performance dashboard. It supports backtesting from a custom start date and can limit trades to one per session for discipline. Alerts are built-in for entries, exits, and stop-loss adjustments, making it compatible with automated trading bots.
Key Benefits:
Trend Reversal Detection: Spots higher highs/lows and lower highs/lows to confirm trend changes.
Session Filtering: Trades only during high-liquidity sessions to avoid choppy markets.
Risk Control: Automatically calculates position sizes to risk only a set percentage or dollar amount per trade.
Performance Tracking: Displays a table of weekly or monthly P&L (profit and loss) with color-coded heatmaps for easy review.
Customizable: Adjust trade direction, risk levels, take-profit ratios, and more via inputs.
The strategy uses a 1:1.2 risk-reward ratio by default but can be tweaked.
How It Works
Trend Identification:
The script calculates pivot highs and lows using left (4) and right (2) bars to detect swing points.
It identifies patterns like Higher Highs (HH), Higher Lows (HL), Lower Highs (LH), and Lower Lows (LL) to determine the trend direction (uptrend if above resistance, downtrend if below support).
Support (green dotted lines) and resistance (red dotted lines) are drawn dynamically and update on trend changes.
Bars are colored blue (uptrend) or black (downtrend) for visual clarity.
Entry Signals:
Long Entry: Price closes above the 200 EMA, trend shifts from down to up (e.g., breaking resistance), during an active session (London or NY), and no trade has been taken that session (if enabled).
Short Entry: Price closes below the 200 EMA, trend shifts from up to down (e.g., breaking support), during an active session, and no prior trade that session.
Trades can be restricted to "Long Only," "Short Only," or "Both."
Entries are filtered by a start date (e.g., from January 2022) and optional month-specific testing.
Position Sizing and Risk:
Risk per trade: Either a fixed dollar amount (e.g., $500) or percentage of equity (e.g., 1%).
Quantity is calculated as: Risk Amount / (Entry Price - Stop-Loss Price).
This ensures you never risk more than intended, regardless of market volatility.
Stop-Loss (SL) and Take-Profit (TP):
SL for Longs: Set below the recent support level, adjustable by a "reduce value" (e.g., tighten by 0-90%) and gap (e.g., add a buffer).
SL for Shorts: Set above the recent resistance level, with similar adjustments.
TP: Based on risk-reward ratio (default 1.2:1), so if SL is 100 pips away, TP is 120 pips in profit.
Visual boxes show SL (red) and TP (green) on the chart for the next 4 bars after entry.
Trade Management:
Trailing SL: Automatically moves SL to the new support (longs) or resistance (shorts) if it tightens the stop without increasing risk.
Breakeven Move: If enabled, SL moves to entry price once profit reaches a set ratio of initial risk (default 1:1). For example, if risk was 1%, SL moves to breakeven at 1% profit.
One Trade Per Session: Prevents multiple entries in the same London or NY session to avoid overtrading.
Sessions include optional weekend inclusion and are highlighted (blue for London, green for NY).
Risk Limits (Weekly/Monthly):
Monitors P&L for the current week or month.
Stops trading if losses hit a limit (e.g., -3%) or profits reach a target (e.g., +7%).
Resets at the start of each new week/month.
Alerts notify when limits are hit.
Exits:
Trades exit at TP, SL, or manually via alerts.
No time-based exits; relies on price action.
Performance Dashboard:
A customizable table (position, size, colors) shows P&L percentages for each week/month in a grid.
Rows = Years, Columns = Weeks (1-52) or Months (1-12).
Color scaling: Green for profits (darker for bigger wins), red for losses (darker for bigger losses).
Yearly totals in the last column.
Helps visualize strategy performance over time without manual calculations.
Input Parameters Explained
Here's a breakdown of the main inputs for easy customization:
Trade Direction: "Both" (default), "Long Only," or "Short Only" – Controls allowed trade types.
Test Only Selected Month: If true, backtests only the specified month from the start year.
Start Year/Month: Sets the backtest start date (default: Jan 2022).
Include Weekends: If true, sessions can include weekends (rarely useful for forex).
Only One Trade Per Session: Limits to one entry per London/NY session (default: true).
Risk Management Time Frame: "Weekly" or "Monthly" – For P&L limits.
Enable Limits: Toggle weekly/monthly stop trading on loss/profit thresholds.
Loss Limit (%)/Profit Target (%): Stops trading if P&L hits these (e.g., -3% loss or +7% profit).
London/New York Session: Enable/disable, with time ranges (e.g., London: 0800-1300 UTC).
Left/Right Bars: For pivot detection (default: 4 left, 2 right) – Higher values smooth signals.
Support/Resistance: Toggle lines, colors, style, width.
Change Bar Color: Colors bars based on trend.
TP RR: Take-profit risk-reward (default: 1.2).
Stoploss Reduce Value: Tightens SL (negative values widen it, 0-0.9 range).
Stoploss Gap: Adds a buffer to SL (e.g., 0.1% away from support).
Move to Breakeven: Enables SL move to entry at a profit ratio (default: true, 1:1).
Use Risk Amount $: If true, risks fixed $ (e.g., 500); else, % of equity (default: 1%).
EMA 3: The slow EMA period (default: 200) for trend filter.
Performance Display: Toggle table, location (e.g., Bottom Right), size, colors, scaling for heatmaps.
Setup and Usage Tips
Add to Chart: Copy the script into TradingView's Pine Editor, compile, and add to your chart.
Backtesting: Use the Strategy Tester tab. Adjust inputs and test on historical data.
Live Trading: Connect alerts to a broker or bot (e.g., via webhook). The script sends JSON-formatted alerts for entry, exit, SL moves, and limits.
Best Markets: Works well on crypto pairs like SOLUSD or RUNEUSD on 4H timeframes.
Risk Warning: This is not financial advice. Always use demo accounts first. Past performance doesn't guarantee future results. Commission is set to 0.05% by default – adjust for your broker.
Customization: Experiment with EMA length or RR ratio for your style.

3-Candle Reversal Pattern-vahid2star3-Candle Reversal Zones + Hammer Confirmation (with Risk Management & Alerts)
This script combines 3-candle reversal detection, hammer confirmations, and smart demand/supply zone plotting into a single tool designed for both discretionary and automated traders.
🔍 Core Logic
3-Candle Reversal Pattern
Candle-1: Strong move in one direction (big body).
Candle-2: Doji-like candle (high shadow/body ratio).
Candle-3: Reversal candle in the opposite direction (large body relative to Candle-2).
A gap after Candle-3 is required for extra confirmation.
Hammer Confirmation (Hammer-1 & Hammer-2)
After a valid 3-candle setup, the script searches for a hammer pattern near the zone.
Hammer-1: Draws a box directly on the hammer range if followed by a strong confirming candle.
Hammer-2: If another hammer forms after the confirmation candle and holds for N bars (configurable), a second hammer box is drawn.
Demand & Supply Zones
For bullish setups, a demand zone is created from the Candle-2 low to the Candle-1 low.
For bearish setups, a supply zone is created from the Candle-2 high to the Candle-1 high.
Zones extend to the right until price interacts with them.
🛠 Filters & Quality Controls
Trend filter (optional):
Only draw zones if price respects higher-timeframe EMA200 slope and LTF EMA alignment.
Market structure filter:
Require higher-high / higher-low (for bullish) or lower-high / lower-low (for bearish).
ATR filter:
Zones must have a minimum height relative to ATR.
Overlap control:
Avoid drawing zones that overlap too heavily with existing ones.
Cooldown:
Restrict consecutive zones of the same type within a user-defined bar distance.
🎯 Risk Management & Strategy
Dynamic position sizing:
Trade size is automatically calculated from account equity, risk %, and leverage.
Stop-loss & Take-profit:
SL placed just beyond the zone ± buffer ticks.
TP automatically set at user-defined Reward:Risk ratio (e.g., 3:1).
Capital protection:
Trades respect max leverage and risk per position settings.
⚡ Alerts
The script provides one-time alerts for each zone:
🔔 First Touch Alert → Triggered when price first touches a demand, supply, or hammer box.
Each zone only fires one alert, avoiding duplicates on re-touch or trade exit.
📊 Visuals
Demand zones: Green boxes.
Supply zones: Red boxes.
Hammer boxes: Blue (bullish) / Orange (bearish).
Used zones: Greyed out after price fills them.
Outcomes: Zones change to green if TP is hit, red if SL is hit.
Optional labels mark “Bullish zone ✓”, “Bearish zone ✓”, “Hammer-1 ✓”, or “Hammer-2 ✓” when confirmed.
🔧 Settings Overview
Core pattern ratios (C1/C2, C3/C2 size multipliers).
Doji definition (shadow/body ratio).
Hammer search depth, confirmation delay, and strictness.
Risk % per trade, leverage cap, stop buffer, RR ratio.
Visual styling (colors, max box count, labels).
Trend, structure, ATR, overlap, and cooldown filters.
Option to disable orders (use as indicator + alerts only).
⚠️ Disclaimer
This script is a technical analysis tool intended for educational purposes.
It does not guarantee profits. Use proper risk management and test thoroughly before applying in live trading.
✨ With its combination of 3-candle reversals, hammer confirmations, and smart filtering, this script is designed to reduce noise, highlight high-probability zones, and give traders both visual structure and actionable alerts.

Golden Cross Strategy & BacktesterGolden Cross Strategy & Backtester 📈🚀
Overview
This script provides a complete backtesting environment for the classic Golden Cross trend-following strategy. It is designed to be simple, visual, and easy to use. 💪
The strategy operates on the following logic:
🔼 Long Entry: A "Buy" signal is generated when the short-term moving average (Short MA) crosses above the long-term moving average (Long MA).
🔽 Exit: The position is closed when the short-term moving average crosses back below the long-term moving average (a "Death Cross").
The background of the chart will be shaded green 🎨 during periods when the strategy is holding an active position.
How to Use for Backtesting 🔬
This is a strategy script, which means its main purpose is to test the historical performance of this trading idea.
Add this script to your chart.
Open the "Strategy Tester" panel at the bottom of your chart.
In the "Overview" and "Performance" tabs, you can see detailed results 📊, such as the Net Profit and Max Drawdown, to evaluate the strategy's effectiveness.
Customization ⚙️
You can easily customize the strategy's parameters without editing the code.
Click the Settings/Gear icon (⚙️) next to the script's name on your chart.
In the "Inputs" tab, you can change:
📏 Short MA Length: The period for the fast-moving average (default is 50).
📏 Long MA Length: The period for the slow-moving average (default is 200).
In the "Properties" tab, you can change:
💰 Initial Capital: The starting balance for the backtest.
Feel free to test different settings to find what works best for your preferred asset and timeframe! Happy testing! 🎉

Mutanabby_AI | ATR+ | Trend-Following StrategyThis document presents the Mutanabby_AI | ATR+ Pine Script strategy, a systematic approach designed for trend identification and risk-managed position entry in financial markets. The strategy is engineered for long-only positions and integrates volatility-adjusted components to enhance signal robustness and trade management.
Strategic Design and Methodological Basis
The Mutanabby_AI | ATR+ strategy is constructed upon a foundation of established technical analysis principles, with a focus on objective signal generation and realistic trade execution.
Heikin Ashi for Trend Filtering: The core price data is processed via Heikin Ashi (HA) methodology to mitigate transient market noise and accentuate underlying trend direction. The script offers three distinct HA calculation modes, allowing for comparative analysis and validation:
Manual Calculation: Provides a transparent and deterministic computation of HA values.
ticker.heikinashi(): Utilizes TradingView's built-in function, employing confirmed historical bars to prevent repainting artifacts.
Regular Candles: Allows for direct comparison with standard OHLC price action.
This multi-methodological approach to trend smoothing is critical for robust signal generation.
Adaptive ATR Trailing Stop: A key component is the Average True Range (ATR)-based trailing stop. ATR serves as a dynamic measure of market volatility. The strategy incorporates user-defined parameters (
Key Value and ATR Period) to calibrate the sensitivity of this trailing stop, enabling adaptation to varying market volatility regimes. This mechanism is designed to provide a dynamic exit point, preserving capital and locking in gains as a trend progresses.
EMA Crossover for Signal Generation: Entry and exit signals are derived from the interaction between the Heikin Ashi derived price source and an Exponential Moving Average (EMA). A crossover event between these two components is utilized to objectively identify shifts in momentum, signaling potential long entry or exit points.
Rigorous Stop Loss Implementation: A critical feature for risk mitigation, the strategy includes an optional stop loss. This stop loss can be configured as a percentage or fixed point deviation from the entry price. Importantly, stop loss execution is based on real market prices, not the synthetic Heikin Ashi values. This design choice ensures that risk management is grounded in actual market liquidity and price levels, providing a more accurate representation of potential drawdowns during backtesting and live operation.
Backtesting Protocol: The strategy is configured for realistic backtesting, employing fill_orders_on_standard_ohlc=true to simulate order execution at standard OHLC prices. A configurable Date Filter is included to define specific historical periods for performance evaluation.
Data Visualization and Metrics: The script provides on-chart visual overlays for buy/sell signals, the ATR trailing stop, and the stop loss level. An integrated information table displays real-time strategy parameters, current position status, trend direction, and key price levels, facilitating immediate quantitative assessment.
Applicability
The Mutanabby_AI | ATR+ strategy is particularly suited for:
Cryptocurrency Markets: The inherent volatility of assets such as #Bitcoin and #Ethereum makes the ATR-based trailing stop a relevant tool for dynamic risk management.
Systematic Trend Following: Individuals employing systematic methodologies for trend capture will find the objective signal generation and rule-based execution aligned with their approach.
Pine Script Developers and Quants: The transparent code structure and emphasis on realistic backtesting provide a valuable framework for further analysis, modification, and integration into broader quantitative models.
Automated Trading Systems: The clear, deterministic entry and exit conditions facilitate integration into automated trading environments.
Implementation and Evaluation
To evaluate the Mutanabby_AI | ATR+ strategy, apply the script to your chosen chart on TradingView. Adjust the input parameters (Key Value, ATR Period, Heikin Ashi Method, Stop Loss Settings) to observe performance across various asset classes and timeframes. Comprehensive backtesting is recommended to assess the strategy's historical performance characteristics, including profitability, drawdown, and risk-adjusted returns.
I'd love to hear your thoughts, feedback, and any optimizations you discover! Drop a comment below, give it a like if you find it useful, and share your results.

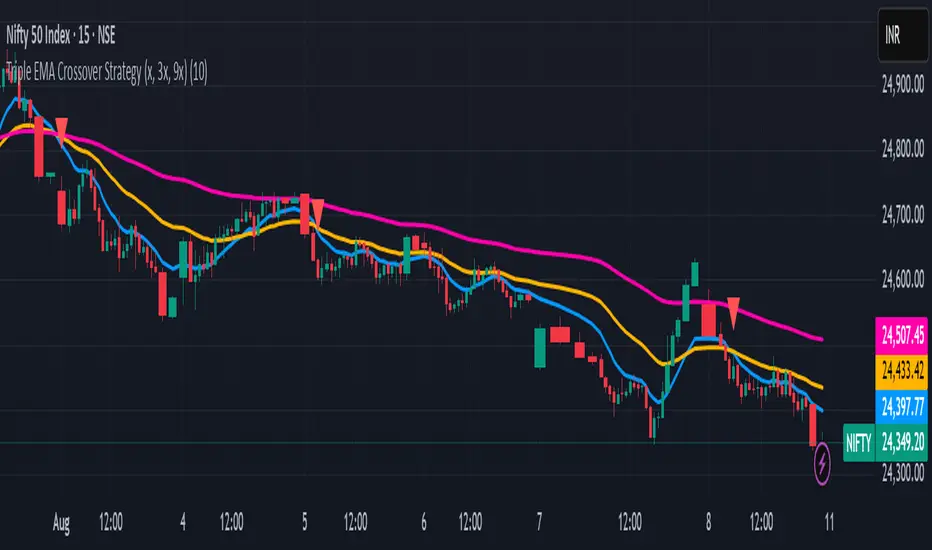
1 Triple EMA Crossover Strategy (x, 3x, 9x)An excellent EMA strategy.
x, 3x, and 9x: These represent the periods of the EMAs. For example, if 'x' is 10, then you would have a 10-day EMA, a 30-day EMA, and a 90-day EMA.
Crossover: The strategy relies on identifying when the price or the shorter-term EMAs cross above or below the longer-term EMAs, signaling potential buy or sell opportunities.
How the Strategy Works:
1. Trend Identification:
The relationship between the three EMAs indicates the overall trend. If the 3x EMA is above the 9x EMA, and the x EMA is above both, it suggests an uptrend. Conversely, if the 3x EMA is below the 9x EMA, and the x EMA is below both, it indicates a downtrend.
2. Buy Signals:
A buy signal might be generated when the shortest EMA (x) crosses above the medium EMA (3x) and then both cross above the longest EMA (9x), suggesting a potential breakout.
3. Sell Signals:
A sell signal might be generated when the shortest EMA (x) crosses below the medium EMA (3x) and then both cross below the longest EMA (9x), suggesting a potential breakdown.
---------------------------------------------------------------------------------------------------------
Unlocking Trends with the Triple EMA Crossover Strategy (x, 3x, 9x)
Welcome to an intuitive yet powerful trend-following strategy designed for clarity and actionable signals: the Triple EMA Crossover. This Pine Script® indicator leverages the Exponential Moving Average (EMA) to help traders identify prevailing trends, potential breakouts, and breakdowns with enhanced precision. Built on a simple, scalable 'x, 3x, 9x' methodology, it provides a dynamic framework for navigating market movements.
Understanding the x, 3x, 9x EMA Foundation
At its core, this strategy utilizes three Exponential Moving Averages, each acting as a distinct lens on price action. Unlike Simple Moving Averages (SMAs) which give equal weight to all data points, EMAs place a greater emphasis on recent prices, making them more responsive to current market conditions—a crucial advantage in fast-paced environments like intraday trading.
The "x, 3x, 9x" nomenclature is elegantly simple:
x EMA (Fast EMA): This is your shortest-period EMA, highly sensitive to immediate price changes. It acts as the leading indicator, quickly reacting to shifts in momentum.
3x EMA (Medium EMA): Calculated with three times the 'x' period, this EMA provides a smoother, yet still responsive, view of the short-to-medium term trend. It often acts as dynamic support or resistance.
9x EMA (Slow EMA): Representing nine times the 'x' period, this is your longest EMA. It filters out much of the market noise, giving you a clear picture of the underlying dominant trend.
The beauty of this setup lies in its adaptability. By simply adjusting the Base EMA Period (x) input in the script settings, you can automatically calibrate all three EMAs to suit different instruments, volatility levels, or even your preferred trading style. A common starting point for 'x' in intraday trading on a 5-minute chart is 10, which translates to 10, 30, and 90-period EMAs.
How the Strategy Works: Signals and Trend Identification
The power of the Triple EMA Crossover lies in the interplay and alignment of these three moving averages.
1. Trend Identification
The relative positioning of the EMAs paints a clear picture of the market's trend:
Uptrend (Bullish): When the emaX (fast) is above the ema3X (medium), and the ema3X is, in turn, above the ema9X (slow), it indicates a strong bullish trend. This "stacked" alignment suggests robust upward momentum.
Downtrend (Bearish): Conversely, if the emaX (fast) is below the ema3X (medium), and the ema3X is below the ema9X (slow), it signals a clear bearish trend.
2. Buy Signals 🟢
A buy signal is generated when the swift emaX crosses above the ema3X, AND simultaneously, the ema3X is already above the ema9X. This combined condition ensures that the shorter-term momentum is shifting upward while the underlying medium-term trend remains strong and aligned with the longer-term direction. This reduces false signals often seen with simple two-EMA crossovers, aiming to capture high-probability upward moves. The script will plot a green upward-pointing triangle below the candle to visually alert you to this entry.
3. Sell Signals 🔴
A sell signal occurs when the quick emaX crosses below the ema3X, AND the ema3X is already below the ema9X. This indicates that the short-term momentum is shifting downwards, confirming a bearish bias within the broader downtrend. This comprehensive confirmation helps identify potential breakdowns and exit points for long positions or entry points for short trades. A red downward-pointing triangle will appear above the candle to mark this signal.
The strategy also includes an intuitive exit mechanism: if a buy signal is active and a sell condition is met, the long position will be closed, and vice-versa for short positions. This ensures you're always aligned with the most recent confirmed trend direction.
Key Advantages for Traders
Clarity: Provides visually clear trend direction and momentum shifts.
Responsiveness: EMAs react faster to price changes compared to SMAs, making them ideal for dynamic markets.
Confirmation: The three-EMA alignment significantly reduces false signals, leading to higher-conviction trades.
Adaptability: The x input allows you to fine-tune the strategy for various assets and market conditions.
Simplicity: Despite its effectiveness, the logic remains straightforward and easy to understand.
Important Considerations for Day Trading
For optimal performance in intraday trading, it's highly recommended to apply this strategy on a 5-minute chart. This timeframe strikes the perfect balance between capturing rapid price action and filtering out excessive market noise, allowing the EMA crossovers to provide meaningful signals. Always combine this technical analysis with sound risk management, including stop-loss orders, and consider other indicators or fundamental analysis for further confirmation.
Customization and Disclaimer
Feel free to experiment with the Base EMA Period (x) input to find the optimal settings that resonate with your trading style and the specific instruments you trade. Remember, no single strategy guarantees profits, and past performance is not indicative of future results. This script is provided for educational and illustrative purposes. Always conduct your own research and risk assessment before trading with real capital. Happy Trading!
Engulfing & Pin Bar Breakout StrategyOverview
This strategy automates a classic, powerful trading methodology based on identifying key candlestick reversal patterns and trading the subsequent price breakout. It is designed to be a complete, "set-and-go" system with built-in risk and position size management.
The core logic operates on the 1-Hour timeframe, scanning for four distinct high-probability reversal signals: two bullish and two bearish. An entry is only triggered when the market confirms the signal by breaking a key price level, aiming to capture momentum following a potential shift in market sentiment.
The Strategy Logic
The system is composed of two distinct modules: Bullish (Long) and Bearish (Short).
🐂 Bullish (Long) Setup
The script initiates a long trade based on the following strict criteria:
Signal: Identifies either a Hammer or a Bullish Engulfing pattern. These patterns often indicate that sellers are losing control and buyers are stepping in.
Confirmation: Waits for the very next candle after the signal.
Entry Trigger: A long position is automatically opened as soon as the price breaks above the high of the signal candle.
Stop Loss: Immediately set just below the low of the signal candle.
Take Profit: A fixed target is placed at a 1:5 Risk/Reward Ratio.
🐻 Bearish (Short) Setup
The script initiates a short trade based on the following strict criteria:
Signal: Identifies either a Shooting Star or a Bearish Engulfing pattern. These patterns suggest buying pressure is fading and sellers are taking over.
Confirmation: Waits for the very next candle after the signal.
Entry Trigger: A short position is automatically opened as soon as the price breaks below the low of the signal candle.
Stop Loss: Immediately set just above the high of the signal candle.
Take Profit: A fixed target is placed at a 1:4 Risk/Reward Ratio.
Key Feature: Automated Risk Management
This strategy is designed for disciplined trading. You do not need to calculate position sizes manually.
Fixed Risk: The script automatically calculates the correct position size to risk exactly 2% of your total account equity on every single trade.
Dynamic Sizing: The position size will adjust based on the distance between your entry price and your stop loss for each specific setup, ensuring a consistent risk profile.
How To Use
Apply the script to your chosen chart (e.g., BTC/USD).
Crucially, set your chart's timeframe to 1-Hour (H1). The strategy is specifically calibrated for this interval.
Navigate to the "Strategy Tester" tab below your chart to view backtest results, including net profit, win rate, and individual trades.
Disclaimer: This script is provided for educational and informational purposes only. It is not financial advice. All trading involves substantial risk, and past performance is not indicative of future results. Please use this tool responsibly and at your own risk.

ETH/SOL 1D Dynamic Trend Core - STRATEGY v 45Overview
The Dynamic Trend Core is a sophisticated, multi-layer trading engine designed to identify high-probability, trend-following opportunities. Its core philosophy is rooted in confluence, meaning it requires multiple conditions across trend, momentum, and volume to align before generating a signal. This approach aims to filter out market noise and provide a clearer view of the underlying trend.
The script includes a comprehensive backtesting engine for strategy optimization and a rich, intuitive visual interface for real-time analysis.
How It Works: Core Logic
The engine validates signals through several sequential layers:
Primary Trend Analysis (SAMA): The foundation is a Self-Adjusting Moving Average (SAMA) that dynamically determines the primary market direction (Bullish, Bearish, or Consolidation).
Momentum Confirmation: Signals are then qualified using a blend of the Natural Market Slope and a Cyclic RSI to ensure momentum is firmly aligned with the established trend.
Advanced Filtering Suite: A suite of optional filters provides robust confirmation and allows for deep customization:
Volume & ADX: Confirms that trades are supported by sufficient market participation and trend strength.
Market Regime: Gauges broad market health (e.g., using TOTAL market cap) to avoid trading against the entire market.
Multi-Timeframe (MTF) Analysis: Aligns signals with the dominant trend on a higher timeframe (e.g., Weekly).
BTC Cycle Analysis: Positions trades within the context of historical Bitcoin cycles using models like the Halving Cycle or Mayer Multiple.
On-Chart Visuals & Features
The script provides full transparency into its logic with a powerful on-chart interface.
IMPORTANT: For the live visual elements to function correctly, you must enable "Recalculate on every tick" in the script's settings (Settings > Properties).
Power Core Gauge: Located at the bottom-center of the chart, this gauge is the heart of the system. It displays the number of filter conditions currently met (e.g., 5/6) and "powers up" by glowing brighter as more conditions align, indicating a fully confirmed signal is ready.
Live Conditions Panel: This panel in the bottom-right corner acts as a real-time pre-flight checklist. It shows the status (pass/fail) of every individual filter, so you know exactly why a signal is, or is not, being generated.
Energized Trendline: The primary SAMA trendline changes color and intensity based on the strength and direction of the trend, offering immediate visual context.
BTC Halving Cycle Visualizer: Provides a background color guide to the different phases of the Bitcoin halving cycle for macro context.
How to Use & Configure
Select Operation Mode:
Backtest Mode: Use this to test different settings on historical data and find optimal configurations for a specific asset and timeframe.
Alerts-Only Mode: Use this for live trading to generate alert signals without cluttering the chart with backtest data. (Contact publisher for access to this version)
Configure Your Filters:
Start with the default filter settings.
If a potential setup is missed, check the Live Conditions Panel to see which specific filter blocked the signal.
Enable, disable, or adjust filters in the script's settings to match your trading style and the asset's characteristics.
Manage Your Risk:
Go to the "Risk & Exit" settings to configure your Stop Loss and Take Profit parameters to match your personal risk tolerance.
Disclaimer: This script is for educational and informational purposes only. It is not financial advice. All trading involves risk, and past performance is not indicative of future results. Please conduct your own research and backtesting before making any trading decisions.

Gemini Trend Following SystemStrategy Description: The Gemini Trend Following System
Core Philosophy
This is a long-term trend-following system designed for a position trader or a patient swing trader, not a day trader. The fundamental goal is to capture the majority of a stock's major, multi-month or even multi-year uptrend.
The core principle is: "Buy weakness in a confirmed uptrend, and sell only when the uptrend's structure is fundamentally broken."
It operates on the belief that it's more profitable to ride a durable trend than to chase short-term breakouts or worry about daily price fluctuations. It prioritizes staying in a winning trade over frequent trading.
The Three Pillars of the Strategy
The script's logic is built on three distinct pillars, processed in order:
1. The Regime Filter: "Is This Stock in a Healthy Uptrend?"
Before even considering a trade, the script acts as a strict gatekeeper. It will only "watch" a stock if it meets all the criteria of a healthy, long-term uptrend. This is the most important part of the strategy as it filters out weak or speculative stocks.
A stock passes this filter if:
The 50-day Simple Moving Average (SMA) is above the 200-day SMA. This is the classic definition of a "Golden Cross" state, indicating the medium-term trend is stronger than the long-term trend—a hallmark of a bull market for the stock.
The stock's performance over the last year is positive. The Rate of Change (ROC) must be above a minimum threshold (e.g., 15%). This ensures we are only looking at stocks that have already demonstrated significant strength.
The 200-day SMA itself is rising. This is a crucial check to ensure the very foundation of the trend is solid and not flattening out or beginning to decline.
If a stock doesn't meet these conditions, the script ignores it completely.
2. The Entry Trigger: "When to Buy the Dip"
Once a stock is confirmed to be in a healthy uptrend, the script does not buy immediately. Instead, it patiently waits for a point of lower risk and higher potential reward—a pullback.
The entry trigger is a specific, two-step sequence:
The stock price first dips and closes below its 50-day SMA. This signifies a period of temporary weakness or profit-taking.
The price then recovers and closes back above the 50-day SMA within a short period (10 bars).
This sequence is a powerful signal. It suggests that institutional buyers view the 50-day SMA as a key support level and have stepped in to defend it, overpowering the sellers. The entry occurs at this point of confirmed support, marking the likely resumption of the uptrend. On the chart, this event is highlighted with a teal background.
3. The Exit Strategy: "When is the Trend Over?"
The exit logic is designed to keep you in the trade as long as possible and only sell when the trend's character has fundamentally changed. It uses a dual-exit system:
Primary Exit (Trend Failure): The main reason to sell is a "Death Cross"—when the 50-day SMA crosses below the 200-day SMA. This is a robust, albeit lagging, signal that the long-term uptrend is over and a bearish market structure is taking hold. This exit condition is designed to ignore normal market corrections and only trigger when the underlying trend has truly broken. On the chart, this is highlighted with a maroon background.
Safety-Net Exit (Catastrophic Stop-Loss): To protect against a sudden market crash or a company-specific disaster, a "safety-net" stop-loss is placed at the time of entry. This stop is set far below the entry price, typically underneath the 200-day SMA. It is a "just-in-case" measure that should only be triggered in a severe and rapid decline, protecting your capital from an unexpected black swan event.
Who is This Strategy For?
Position Traders: Investors who are comfortable holding a stock for many months to over a year.
Patient Swing Traders: Traders who want to capture large price swings over weeks and months, not days.
Investors using a Rules-Based Approach: Anyone looking to apply a disciplined, non-emotional system to their long-term portfolio.
Ideal Market Conditions
This strategy excels in markets with clear, durable trends. It performs best on strong, leading stocks during a sustained bull market. It will underperform significantly or generate losses in choppy, sideways, or range-bound markets, where the moving averages will frequently cross back and forth, leading to "whipsaw" trades.

US Index First 30m Candle Strategy (10m Chart)Strategy Description for Publishing
Title: US Index First 30-Minute Candle Strategy (10m Chart)
Overview:
This Pine Script implements a trading strategy designed to capitalize on price movements within the first 30 minutes of the U.S. stock market opening. It is specifically tailored for use on a 15-minute chart and is optimized for trading U.S. indices during regular market hours.
Features:
Session Time Configuration: The strategy operates within the U.S. market hours, specifically from 9:30 AM to 4:00 PM (Eastern Time).
First 30-Minute Candle Aggregation: The script identifies the high and low of the first 30-minute candle, which is considered a critical time frame for market momentum.
Single Trade Per Day: To minimize risk, the strategy is designed to execute only one trade per day based on the established range of the first 30 minutes.
Dynamic Trade Conditions: Buy and sell signals are generated when the price breaks above the high or below the low of the first 30-minute candle, with defined stop-loss and take-profit levels based on a customizable risk-reward ratio.
How It Works:
Initialization:
At the start of each trading day, the script resets the high and low values for the first 30 minutes.
Range Locking: After the first 30 minutes, the high and low values are locked, allowing for trade entries based on these levels.
Trade Execution:
Long Entry: Triggered when the price moves above the locked high.
Short Entry: Triggered when the price drops below the locked low.
Risk Management: Each trade comes with a stop-loss and take-profit mechanism to manage potential losses and secure profits.
Visuals:
The script also plots the locked high and low levels on the chart, providing a visual reference for traders.
Conclusion:
This strategy leverages the volatility often seen in the first 30 minutes of trading, aiming to capture significant price movements while maintaining a disciplined trading approach. It is suitable for traders looking to implement a systematic strategy based on early market behavior.
Usage:
To use this strategy, simply add the script to your TradingView chart, set your desired parameters, and monitor for trade signals during the specified market hours. Adjust the risk-reward ratio as needed to align with your trading style.

Ticker Pulse Meter + Fear EKG StrategyDescription
The Ticker Pulse Meter + Fear EKG Strategy is a technical analysis tool designed to identify potential entry and exit points for long positions based on price action relative to historical ranges. It combines two proprietary indicators: the Ticker Pulse Meter (TPM), which measures price positioning within short- and long-term ranges, and the Fear EKG, a VIX-inspired oscillator that detects extreme market conditions. The strategy is non-repainting, ensuring signals are generated only on confirmed bars to avoid false positives. Visual enhancements, such as optional moving averages and Bollinger Bands, provide additional context but are not core to the strategy's logic. This script is suitable for traders seeking a systematic approach to capturing momentum and mean-reversion opportunities.
How It Works
The strategy evaluates price action using two key metrics:
Ticker Pulse Meter (TPM): Measures the current price's position within short- and long-term price ranges to identify momentum or overextension.
Fear EKG: Detects extreme selling pressure (akin to "irrational selling") by analyzing price behavior relative to historical lows, inspired by volatility-based oscillators.
Entry signals are generated when specific conditions align, indicating potential buying opportunities. Exits are triggered based on predefined thresholds or partial position closures to manage risk. The strategy supports customizable lookback periods, thresholds, and exit percentages, allowing flexibility across different markets and timeframes. Visual cues, such as entry/exit dots and a position table, enhance usability, while optional overlays like moving averages and Bollinger Bands provide additional chart context.
Calculation Overview
Price Range Calculations:
Short-Term Range: Uses the lowest low (min_price_short) and highest high (max_price_short) over a user-defined short lookback period (lookback_short, default 50 bars).
Long-Term Range: Uses the lowest low (min_price_long) and highest high (max_price_long) over a user-defined long lookback period (lookback_long, default 200 bars).
Percentage Metrics:
pct_above_short: Percentage of the current close above the short-term range.
pct_above_long: Percentage of the current close above the long-term range.
Combined metrics (pct_above_long_above_short, pct_below_long_below_short) normalize price action for signal generation.
Signal Generation:
Long Entry (TPM): Triggered when pct_above_long_above_short crosses above a user-defined threshold (entryThresholdhigh, default 20) and pct_below_long_below_short is below a low threshold (entryThresholdlow, default 40).
Long Entry (Fear EKG): Triggered when pct_below_long_below_short crosses under an extreme threshold (orangeEntryThreshold, default 95), indicating potential oversold conditions.
Long Exit: Triggered when pct_above_long_above_short crosses under a profit-taking level (profitTake, default 95). Partial exits are supported via a user-defined percentage (exitAmt, default 50%).
Non-Repainting Logic: Signals are calculated using data from the previous bar ( ) and only plotted on confirmed bars (barstate.isconfirmed), ensuring reliability.
Visual Enhancements:
Optional moving averages (SMA, EMA, WMA, VWMA, or SMMA) and Bollinger Bands can be enabled for trend context.
A position table displays real-time metrics, including open positions, Fear EKG, and Ticker Pulse values.
Background highlights mark periods of high selling pressure.
Entry Rules
Long Entry:
TPM Signal: Occurs when the price shows strength relative to both short- and long-term ranges, as defined by pct_above_long_above_short crossing above entryThresholdhigh and pct_below_long_below_short below entryThresholdlow.
Fear EKG Signal: Triggered by extreme selling pressure, when pct_below_long_below_short crosses under orangeEntryThreshold. This signal is optional and can be toggled via enable_yellow_signals.
Entries are executed only on confirmed bars to prevent repainting.
Exit Rules
Long Exit: Triggered when pct_above_long_above_short crosses under profitTake.
Partial exits are supported, with the strategy closing a user-defined percentage of the position (exitAmt) up to four times per position (exit_count limit).
Exits can be disabled or adjusted via enable_short_signal and exitPercentage settings.
Inputs
Backtest Start Date: Defines the start of the backtesting period (default: Jan 1, 2017).
Lookback Periods: Short (lookback_short, default 50) and long (lookback_long, default 200) periods for range calculations.
Resolution: Timeframe for price data (default: Daily).
Entry/Exit Thresholds:
entryThresholdhigh (default 20): Threshold for TPM entry.
entryThresholdlow (default 40): Secondary condition for TPM entry.
orangeEntryThreshold (default 95): Threshold for Fear EKG entry.
profitTake (default 95): Exit threshold.
exitAmt (default 50%): Percentage of position to exit.
Visual Options: Toggle for moving averages and Bollinger Bands, with customizable types and lengths.
Notes
The strategy is designed to work across various timeframes and assets, with data sourced from user-selected resolutions (i_res).
Alerts are included for long entry and exit signals, facilitating integration with TradingView's alert system.
The script avoids repainting by using confirmed bar data and shifted calculations ( ).
Visual elements (e.g., SMA, Bollinger Bands) are inspired by standard Pine Script practices and are optional, not integral to the core logic.
Usage
Apply the script to a chart, adjust input settings to suit your trading style, and use the visual cues (entry/exit dots, position table) to monitor signals. Enable alerts for real-time notifications.
Designed to work best on Daily timeframe.

OBV ATR Strategy (OBV Breakout Channel) bas20230503ผมแก้ไขจาก OBV+SMA อันเดิม ของเดิม ดูที่เส้น SMA สองเส้นตัดกันมั่นห่วยแตกสำหรับที่ผมลองเทรดจริง และหลักการเบรค ได้แรงบันดาลใจ ATR จาก เทพคอย ที่ใช้กับราคา แต่นี้ใช้กับ OBV แทน
และผมใช้เจมินี้ เพื่อแก้ ให้ เป็น strategy เพื่อเช็คย้อนหลังได้ง่ายกว่าเดิม
หลักการง่ายคือถ้ามันขึ้น มันจะขึ้นเรื่อยๆ
เขียน แบบสุภาพ (น่าจะอ่านได้ง่ายกว่าผมเขียน)
สคริปต์นี้ได้รับการพัฒนาต่อยอดจากแนวคิด OBV+SMA Crossover แบบดั้งเดิม ซึ่งจากการทดสอบส่วนตัวพบว่าประสิทธิภาพยังไม่น่าพอใจ กลยุทธ์ใหม่นี้จึงเปลี่ยนมาใช้หลักการ "Breakout" ซึ่งได้รับแรงบันดาลใจมาจากการใช้ ATR สร้างกรอบของราคา แต่เราได้นำมาประยุกต์ใช้กับ On-Balance Volume (OBV) แทน นอกจากนี้ สคริปต์ได้ถูกแปลงเป็น Strategy เต็มรูปแบบ (โดยความช่วยเหลือจาก Gemini AI) เพื่อให้สามารถทดสอบย้อนหลัง (Backtest) และประเมินประสิทธิภาพได้อย่างแม่นยำ
หลักการของกลยุทธ์: กลยุทธ์นี้ทำงานบนแนวคิดโมเมนตัมที่ว่า "เมื่อแนวโน้มได้เกิดขึ้นแล้ว มีโอกาสที่มันจะดำเนินต่อไป" โดยจะมองหาการทะลุของพลังซื้อ-ขาย (OBV) ที่แข็งแกร่งเป็นพิเศษเป็นสัญญาณเข้าเทร
----
สคริปต์นี้เป็นกลยุทธ์ (Strategy) ที่ใช้ On-Balance Volume (OBV) ซึ่งเป็นอินดิเคเตอร์ที่วัดแรงซื้อและแรงขายสะสม แทนที่จะใช้การตัดกันของเส้นค่าเฉลี่ย (SMA Crossover) ที่เป็นแบบพื้นฐาน กลยุทธ์นี้จะมองหาการ "ทะลุ" (Breakout) ของพลัง OBV ออกจากกรอบสูงสุด-ต่ำสุดของตัวเองในรอบที่ผ่านมา
สัญญาณกระทิง (Bull Signal): เกิดขึ้นเมื่อพลังการซื้อ (OBV) แข็งแกร่งจนสามารถทะลุจุดสูงสุดของตัวเองในอดีตได้ บ่งบอกถึงโอกาสที่แนวโน้มจะเปลี่ยนเป็นขาขึ้น
สัญญาณหมี (Bear Signal): เกิดขึ้นเมื่อพลังการขาย (OBV) รุนแรงจนสามารถกดดันให้ OBV ทะลุจุดต่ำสุดของตัวเองในอดีตได้ บ่งบอกถึงโอกาสที่แนวโน้มจะเปลี่ยนเป็นขาลง
ส่วนประกอบบนกราฟ (Indicator Components)
เส้น OBV
เส้นหลัก ที่เปลี่ยนเขียวเป็นแดง เป็นทั้งแนวรับและแนวต้าน และ จุด stop loss
เส้นนี้คือหัวใจของอินดิเคเตอร์ ที่แสดงถึงพลังสะสมของ Volume
เมื่อเส้นเป็นสีเขียว (แนวรับ): จะปรากฏขึ้นเมื่อกลยุทธ์เข้าสู่ "โหมดกระทิง" เส้นนี้คือระดับต่ำสุดของ OBV ในอดีต และทำหน้าที่เป็นแนวรับไดนามิก
เมื่อเส้นกลายเป็นสีแดงสีแดง (แนวต้าน): จะปรากฏขึ้นเมื่อกลยุทธ์เข้าสู่ "โหมดหมี" เส้นนี้คือระดับสูงสุดของ OBV ในอดีต และทำหน้าที่เป็นแนวต้านไดนามิก
สัญลักษณ์สัญญาณ (Signal Markers):
Bull 🔼 (สามเหลี่ยมขึ้นสีเขียว): คือสัญญาณ "เข้าซื้อ" (Long) จะปรากฏขึ้น ณ จุดที่ OBV ทะลุขึ้นไปเหนือกรอบด้านบนเป็นครั้งแรก
Bear 🔽 (สามเหลี่ยมลงสีแดง): คือสัญญาณ "เข้าขาย" (Short) จะปรากฏขึ้น ณ จุดที่ OBV ทะลุลงไปต่ำกว่ากรอบด้านล่างเป็นครั้งแรก
วิธีการใช้งาน (How to Use)
เพิ่มสคริปต์นี้ลงบนกราฟราคาที่คุณสนใจ
ไปที่แท็บ "Strategy Tester" ด้านล่างของ TradingView เพื่อดูผลการทดสอบย้อนหลัง (Backtest) ของกลยุทธ์บนสินทรัพย์และไทม์เฟรมต่างๆ
ใช้สัญลักษณ์ "Bull" และ "Bear" เป็นตัวช่วยในการตัดสินใจเข้าเทรด
ข้อควรจำ: ไม่มีกลยุทธ์ใดที่สมบูรณ์แบบ 100% ควรใช้สคริปต์นี้ร่วมกับการวิเคราะห์ปัจจัยอื่นๆ เช่น โครงสร้างราคา, แนวรับ-แนวต้านของราคา และการบริหารความเสี่ยง (Risk Management) ของตัวคุณเองเสมอ
การตั้งค่า (Inputs)
SMA Length 1 / SMA Length 2: ใช้สำหรับพล็อตเส้นค่าเฉลี่ยของ OBV เพื่อดูเป็นภาพอ้างอิง ไม่มีผลต่อตรรกะการเข้า-ออกของ Strategy อันใหม่ แต่มันเป็นของเก่า ถ้าชอบ ก็ใช้ได้ เมื่อ SMA สองเส้นตัดกัน หรือตัดกับเส้น OBV
High/Low Lookback Length: (ค่าพื้นฐาน30/แก้ตรงนี้ให้เหมาะสมกับ coin หรือหุ้น ตามความผันผวน ) คือระยะเวลาที่ใช้ในการคำนวณกรอบสูงสุด-ต่ำสุดของ OBV
ค่าน้อย: ทำให้กรอบแคบลง สัญญาณจะเกิดไวและบ่อยขึ้น แต่อาจมีสัญญาณหลอก (False Signal) เยอะขึ้น
ค่ามาก: ทำให้กรอบกว้างขึ้น สัญญาณจะเกิดช้าลงและน้อยลง แต่มีแนวโน้มที่จะเป็นสัญญาณที่แข็งแกร่งกว่า
แน่นอนครับ นี่คือคำแปลฉบับภาษาอังกฤษที่สรุปใจความสำคัญ กระชับ และสุภาพ เหมาะสำหรับนำไปใช้ในคำอธิบายสคริปต์ (Description) ของ TradingView ครับ
---Translate to English---
OBV Breakout Channel Strategy
This script is an evolution of a traditional OBV+SMA Crossover concept. Through personal testing, the original crossover method was found to have unsatisfactory performance. This new strategy, therefore, uses a "Breakout" principle. The inspiration comes from using ATR to create price channels, but this concept has been adapted and applied to On-Balance Volume (OBV) instead.
Furthermore, the script has been converted into a full Strategy (with assistance from Gemini AI) to enable precise backtesting and performance evaluation.
The strategy's core principle is momentum-based: "once a trend is established, it is likely to continue." It seeks to enter trades on exceptionally strong breakouts of buying or selling pressure as measured by OBV.
Core Concept
This is a Strategy that uses On-Balance Volume (OBV), an indicator that measures cumulative buying and selling pressure. Instead of relying on a basic Simple Moving Average (SMA) Crossover, this strategy identifies a "Breakout" of the OBV from its own highest-high and lowest-low channel over a recent period.
Bull Signal: Occurs when the buying pressure (OBV) is strong enough to break above its own recent highest high, indicating a potential shift to an upward trend.
Bear Signal: Occurs when the selling pressure (OBV) is intense enough to push the OBV below its own recent lowest low, indicating a potential shift to a downward trend.
On-Screen Components
1. OBV Line
This is the main indicator line, representing the cumulative volume. Its color changes to green when OBV is rising and red when it is falling.
2. Dynamic Support & Resistance Line
This is the thick Green or Red line that appears based on the strategy's current "mode." This line serves as a dynamic support/resistance level and can be used as a reference for stop-loss placement.
Green Line (Support): Appears when the strategy enters "Bull Mode." This line represents the lowest low of the OBV in the recent past and acts as dynamic support.
Red Line (Resistance): Appears when the strategy enters "Bear Mode." This line represents the highest high of the OBV in the recent past and acts as dynamic resistance.
3. Signal Markers
Bull 🔼 (Green Up Triangle): This is the "Long Entry" signal. It appears at the moment the OBV first breaks out above its high-low channel.
Bear 🔽 (Red Down Triangle): This is the "Short Entry" signal. It appears at the moment the OBV first breaks down below its high-low channel.
How to Use
Add this script to the price chart of your choice.
Navigate to the "Strategy Tester" panel at the bottom of TradingView to view the backtesting results for the strategy on different assets and timeframes.
Use the "Bull" and "Bear" signals as aids in your trading decisions.
Disclaimer: No strategy is 100% perfect. This script should always be used in conjunction with other forms of analysis, such as price structure, key price-based support/resistance levels, and your own personal risk management rules.
Inputs
SMA Length 1 / SMA Length 2: These are used to plot moving averages on the OBV for visual reference. They are part of the legacy logic and do not affect the new breakout strategy. However, they are kept for traders who may wish to observe their crossovers for additional confirmation.
High/Low Lookback Length: (Most Important Setting) This determines the period used to calculate the highest-high and lowest-low OBV channel. (Default is 30; adjust this to suit the asset's volatility).
A smaller value: Creates a narrower channel, leading to more frequent and faster signals, but potentially more false signals.
A larger value: Creates a wider channel, leading to fewer and slower signals, which are likely to be more significant.

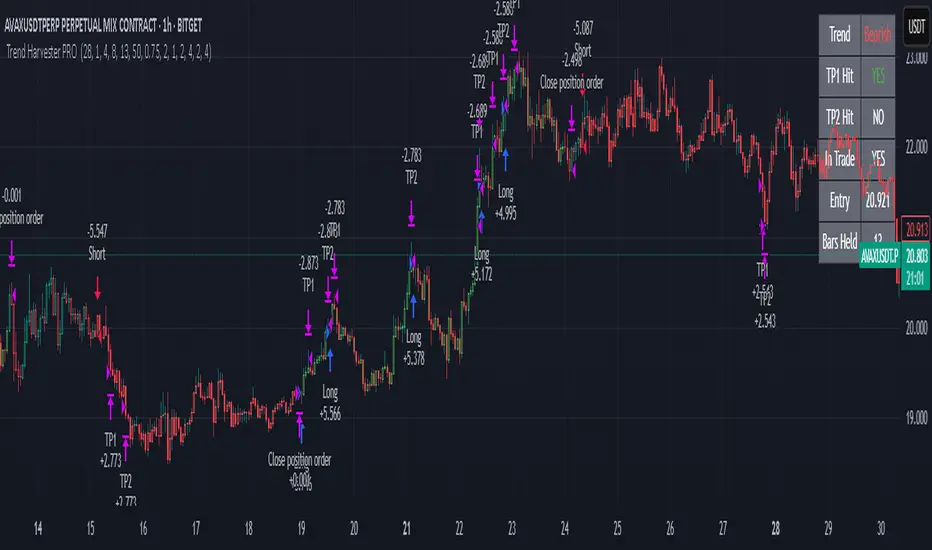
Trend Harvester PRO Trend Harvester PRO – Adaptive Trend-Following Strategy for Crypto
Trend Harvester PRO is a fully systematic trend-following strategy built for cryptocurrency markets on intraday timeframes — particularly optimized for the 1-hour chart. The script combines ZLEMA-based trend tracking, momentum confirmation, and a volatility-aware filter to detect high-probability directional moves with clarity and precision.
This is not a mashup of random indicators — each component serves a specific purpose in validating trends, avoiding choppy zones, and timing entries responsibly.
🔍 Strategy Logic Overview
The core objective is to detect sustainable, real-time trends and exit with multi-stage profit targets. To do this, the script uses several layers of confirmation:
1. 📊 ZLEMA Trend Engine (Zero Lag EMA)
This is the backbone of the strategy.
ZLEMA (Zero-Lag EMA) is a moving average that minimizes lag by adjusting for past data offset.
The strategy uses a fast ZLEMA and a slow ZLEMA, combined with a slope calculation, to assess the current trend.
When:
Fast ZLEMA > Slow ZLEMA
The ZLEMA is rising (positive slope)
→ The market is considered in an uptrend.
Conversely, if:
Fast ZLEMA < Slow ZLEMA
The slope is negative
→ The market is considered in a downtrend.
This setup detects not just direction, but also whether the trend has meaningful acceleration.
2. ⚡ Momentum Confirmation
Trend direction alone isn’t enough — we also need momentum agreement.
The script calculates a smoothed Rate of Change (ROC) to evaluate if momentum supports the direction of the ZLEMA trend.
For long trades: ROC must be positive
For short trades: ROC must be negative
This prevents taking trades where price is crossing moving averages but lacks follow-through power.
3. 🌪️ Volatility Filter
Choppy markets are common in crypto. To reduce false signals:
The script compares short-term volatility (10-bar standard deviation of price changes) to longer-term volatility.
If the ratio is too high (i.e., short-term volatility is spiking), the strategy avoids entry.
This ensures trades are only taken when the market is relatively calm and directional — avoiding false breakouts.
4. 🧠 Confirmation Bars + Trend State
Signals only trigger after a certain number of consecutive bars confirm trend direction (confirmBars).
This prevents reacting to just 1 candle and requires consistent evidence of trend.
A state machine is used to track current trend status:
+1 = confirmed uptrend
-1 = confirmed downtrend
0 = neutral / no trade
This trend state changes only after all conditions are met and confirmation bars pass.
5. 🧊 Cooldown Enforcement
After a trade exits (from TP or a trend reversal), the strategy enforces a cooldown period before new entries are allowed. This:
Prevents back-to-back entries on trend flips
Reduces overtrading
Helps avoid whipsaws or same-bar reversal trades
6. 🎯 Multi-Level Take Profits (TP1 & TP2)
Once a trade is entered:
Two limit exits are set automatically:
TP1: Closes 50% of the position at a configurable profit level
TP2: Closes the remaining 50%
If the trend weakens before TP2 is reached, the position is closed early.
Both long and short trades use the same logic, with user-defined percentages.
This system allows for partial profit-taking while keeping a portion of the trade running.
7. 🧾 Built-in Dashboard
The script includes a real-time dashboard showing:
Trend direction: Bullish, Bearish, or Neutral
Whether TP1 / TP2 was hit
Entry price
If currently in a trade
How many bars the trade has been open
This helps monitor strategy performance at a glance without needing extra labels.
8. 🔔 Webhook-Compatible Alerts
The strategy includes custom alerts that can be used for:
Long and Short entries
TP1 and TP2 hits
Exiting trades
These can be integrated into automated bot systems or used manually.
🔒 Non-Repainting Logic
The strategy uses only confirmed bar data (i.e., values from closed bars).
There are no repainting indicators.
Entries and exits are placed using strategy.entry and strategy.exit on confirmed conditions.
✅ How to Use It
Apply the strategy to 1H altcoin charts (BTC, ETH, SOL, etc.).
Tune the TP percentages (longTP1Pct, longTP2Pct, etc.) based on volatility.
Use the dashboard to monitor trend state and trade progress.
Combine with additional tools (like support/resistance or volume) for higher confluence.
Use the date filter to run backtests over defined periods.
⚠️ Risk Management Notice
This strategy does not include stop losses by default. It is designed to exit based on trend reversal or take-profit limits.
Always backtest thoroughly and use realistic sizing.
Do not risk more than 5–10% of your account on any trade.
Past results do not guarantee future performance. This tool is for educational and research purposes.
🧬 What Makes This Original
Trend Harvester PRO was built from scratch with tightly integrated logic:
ZLEMA tracks early trend direction with low lag
ROC confirms momentum in the same direction
Volatility filter avoids false setups
Multi-bar confirmation and cooldown logic control trade pacing
Dual TP exits manage partial profit-taking
A live dashboard makes real-time tracking intuitive
Unlike mashups of indicators with no synergy, each component here directly supports the quality of trade decisions, and the logic is modular, transparent, and non-repainting.
External Signals Strategy Tester v5External Signals Strategy Tester v5 – User Guide (English)
1. Purpose
This Pine Script strategy is a universal back‑tester that lets you plug in any external buy/sell series (for example, another indicator, webhook feed, or higher‑time‑frame condition) and evaluate a rich set of money‑management rules around it – with a single click on/off workflow for every module.
2. Core Workflow
Feed signals
Buy Signal / Sell Signal inputs accept any series (price, boolean, output of request.security(), etc.).
A crossover above 0 is treated as “signal fired”.
Date filter
Start Date / End Date restricts the test window so you can exclude unwanted history.
Trade engine
Optional Long / Short enable toggles.
Choose whether opposite signals simply close the trade or reverse it (flip direction in one transaction).
Risk modules – all opt‑in via check‑boxes
Classic % block – fixed % Take‑Profit / Stop‑Loss / Break‑Even.
Fibonacci Bollinger Bands (FBB) module
Draws dynamic VWMA/HMA/SMA/EMA/DEMA/TEMA mid‑line with ATR‑scaled Fibonacci envelopes.
Every line can be used for stops, trailing, or multi‑target exits.
Separate LONG and SHORT sub‑modules
Each has its own SL plus three Take‑Profits (TP1‑TP3).
Per TP you set line, position‑percentage to close, and an optional trailing flag.
Executed TP/SLs deactivate themselves so they cannot refire.
Trailing behaviour
If Trail is checked, the selected line is re‑evaluated once per bar; the order is amended via strategy.exit().
3. Inputs Overview
Group Parameter Notes
Trade Settings Enable Long / Enable Short Master switches
Close on Opposite / Reverse Position How to react to a counter‑signal
Risk % Use TP / SL / BE + their % Traditional fixed‑distance management
Fibo Bands FIBO LEVELS ENABLE + visual style/length Turn indicator overlay on/off
FBB LONG SL / TP1‑TP3 Enable, Line, %, Trail Rules applied only while a long is open
FBB SHORT SL / TP1‑TP3 Enable, Line, %, Trail Rules applied only while a short is open
Line choices: Basis, 0.236, 0.382, 0.5, 0.618, 0.764, 1.0 – long rules use lower bands, short rules use upper bands automatically.
4. Algorithm Details
Position open
On the very first bar after entry, the script checks the direction and activates the corresponding LONG or SHORT module, deactivating the other.
Order management loop (every bar)
FBB Stop‑Loss: placed/updated at chosen band; if trailing, follows the new value.
TP1‑TP3: each active target updates its limit price to the selected band (or holds static if trailing is off).
The classic % block runs in parallel; its exits have priority because they call strategy.close_all().
Exit handling
When any strategy.exit() fires, the script reads exit_id and flips the *_Active flag so that order will not be recreated.
A Stop‑Loss (SL) also disables all remaining TPs for that leg.
5. Typical Use Cases
Scenario Suggested Setup
Scalping longs into VWAP‐reversion Enable LONG TP1 @ 0.382 (30 %), TP2 @ 0.618 (40 %), SL @ 0.236 + trailing
Fade shorts during news spikes Enable SHORT SL @ 1.0 (no trail) and SHORT TP1,2,3 on consecutive lowers with small size‑outs
Classic trend‑follow Use only classic % TP/SL block and disable FBB modules
6. Hints & Tips
Signal quality matters – this script manages exits, it does not generate entries.
Keep TV time zone in mind when picking start/end dates.
For portfolio‑style testing allocate smaller default_qty_value than 100 % or use strategy.percent_of_equity sizing.
You can combine FBB exits with fixed‑% ones for layered management.
7. Limitations / Safety
No pyramiding; the script holds max one position at a time.
All calculations are bar‑close; intra‑bar touches may differ from real‑time execution.
The indicator overlay is optional, so you can run visual‑clean tests by unchecking FIBO LEVELS ENABLE.

[Kpt-Ahab] Simple AlgoPilot Riskmgt and Backtest Simple AlgoPilot Riskmgt and Backtest
This script provides a compact solution for automated risk management and backtesting within TradingView.
It offers the following core functionalities:
Risk Management:
The system integrates various risk limitation mechanisms:
Percentage-based or trailing stop-loss
Maximum losing streak limitation
Maximum drawdown limitation relative to account equity
Flexible position sizing control (based on equity, fixed size, or contracts)
Dynamic repurchasing of positions ("Repurchase") during losses with adjustable size scaling
Supports multi-stage take-profit targets (TP1/TP2) and automatic stop-loss adjustment to breakeven
External Signal Processing for Backtesting:
In addition to its own moving average crossovers, the script can process external trading signals:
External signals are received via a source input variable (e.g., from other indicators or signal generators)
Positive values (+1) trigger long positions, negative values (–1) trigger short positions
This allows for easy integration of other indicator-based strategies into backtests
Additional Backtesting Features:
Selection between different MA types (SMA, EMA, WMA, VWMA, HMA)
Flexible time filtering (trade only within defined start and end dates)
Simulation of commission costs, slippage, and leverage
Optional alert functions for moving average crossovers
Visualization of liquidation prices and portfolio development in an integrated table
Note: This script is primarily intended for strategic backtesting and risk setting optimization.
Real-time applications should be tested with caution. All order executions, alerts, and risk calculations are purely simulation-based.
Explanation of Calculations and Logics:
1. Risk Management and Position Sizing:
The position size is calculated based on the user’s choice using three possible methods:
Percentage of Equity:
The position size is a defined fraction of the available capital, dynamically adjusted based on market price (riskPerc / close).
Fixed Size (in currency): The user defines a fixed monetary amount to be used per trade.
Contracts: A fixed number of contracts is traded regardless of the current price.
Leverage: The selected leverage multiplies the position size for margin calculations.
2. Trade Logic and Signal Triggering:
Trades can be triggered through two mechanisms:
Internal Signals:
When a fast moving average crosses above or below a slower moving average (ta.crossover, ta.crossunder). The type of moving averages (SMA, EMA, WMA, VWMA, HMA) can be freely selected.
External Signals:
Signals from other indicators can be received via an input source field.
+1 triggers a long entry, –1 triggers a short entry.
Position Management:
Once entered, the position is actively managed.
Multiple take-profit targets are set.
Upon reaching a profit target, the stop-loss can optionally be moved to breakeven.
3. Stop-Loss and Take-Profit Logic:
Stop-Loss Types:
Fixed Percentage Stop:
A fixed distance below/above the entry price.
Trailing Stop:
Dynamically adjusts as the trade moves into profit.
Fast Trailing Stop:
A more aggressive variant of trailing that reacts quicker to price changes.
Take-Profit Management:
Two take-profit targets (TP1 and TP2) are supported, allowing partial exits at different stages.
Remaining positions can either reach the second target or be closed by the stop-loss.
4. Repurchase Strategy ("Scaling In" on Losses):
If a position reaches a specified loss threshold (e.g., –15%), an automatic additional purchase can occur.
The position size is increased by a configurable percentage.
Repurchases happen only if an initial position is already open.
5. Backtesting Control and Filters:
Time Filters:
A trading period can be defined (start and end date).
All trades outside the selected period are ignored.
Risk Filters: Trading is paused if:
A maximum losing streak is reached.
A maximum allowed drawdown is exceeded.
6. Liquidation Calculation (Simulation Only):
The script simulates liquidation prices based on the account balance and position size.
Liquidation lines are drawn on the chart to better visualize potential risk exposure.
This is purely a visual aid — no real broker-side liquidation is performed.
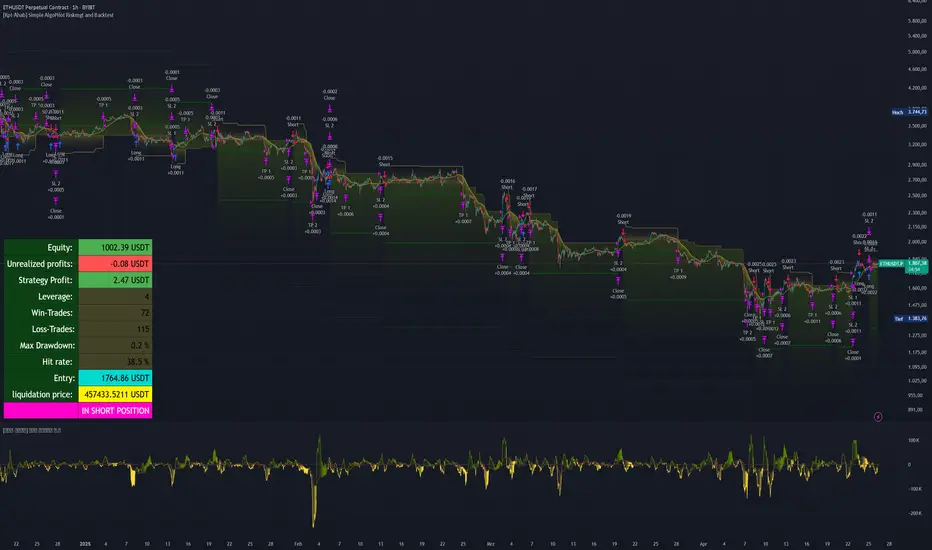
Prop Firm Business SimulatorThe prop firm business simulator is exactly what it sounds like. It's a plug and play tool to test out any tradingview strategy and simulate hypothetical performance on CFD Prop Firms.
Now what is a modern day CFD Prop Firm?
These companies sell simulated trading challenges for a challenge fee. If you complete the challenge you get access to simulated capital and you get a portion of the profits you make on those accounts payed out.
I've included some popular firms in the code as presets so it's easy to simulate them. Take into account that this info will likely be out of date soon as these prices and challenge conditions change.
Also, this tool will never be able to 100% simulate prop firm conditions and all their rules. All I aim to do with this tool is provide estimations.
Now why is this tool helpful?
Most traders on here want to turn their passion into their full-time career, prop firms have lately been the buzz in the trading community and market themselves as a faster way to reach that goal.
While this all sounds great on paper, it is sometimes hard to estimate how much money you will have to burn on challenge fees and set realistic monthly payout expectations for yourself and your trading. This is where this tool comes in.
I've specifically developed this for traders that want to treat prop firms as a business. And as a business you want to know your monthly costs and income depending on the trading strategy and prop firm challenge you are using.
How to use this tool
It's quite simple you remove the top part of the script and replace it with your own strategy. Make sure it's written in same version of pinescript before you do that.
//--$$$$$$$$$$$$$$$$$$$$$$$$$$$$$$$$$$$$$$$$$$$$$$$$--//--------------------------------------------------------------------------------------------------------------------------$$$$$$
//--$$$$$--Strategy-- --$$$$$$--// ******************************************************************************************************************************
//--$$$$$$$$$$$$$$$$$$$$$$$$$$$$$$$$$$$$$$$$$$$$$$$$--//--------------------------------------------------------------------------------------------------------------------------$$$$$$
length = input.int(20, minval=1, group="Keltner Channel Breakout")
mult = input(2.0, "Multiplier", group="Keltner Channel Breakout")
src = input(close, title="Source", group="Keltner Channel Breakout")
exp = input(true, "Use Exponential MA", display = display.data_window, group="Keltner Channel Breakout")
BandsStyle = input.string("Average True Range", options = , title="Bands Style", display = display.data_window, group="Keltner Channel Breakout")
atrlength = input(10, "ATR Length", display = display.data_window, group="Keltner Channel Breakout")
esma(source, length)=>
s = ta.sma(source, length)
e = ta.ema(source, length)
exp ? e : s
ma = esma(src, length)
rangema = BandsStyle == "True Range" ? ta.tr(true) : BandsStyle == "Average True Range" ? ta.atr(atrlength) : ta.rma(high - low, length)
upper = ma + rangema * mult
lower = ma - rangema * mult
//--Graphical Display--// *-*-*-*-*-*-*-*-*-*-*-*-*-*-*-*-*-*-*-*-*-*-*-*-*-*-*-*-*-*-*-*-*-*-*-*-*-*-*-*-*-*-*-*-*-*-*-*-*-*-*-*-*-*-*-*-*-*-*-*-*-*-*-*-*-*-*-*-*-*-*-*-*-$$$$$$
u = plot(upper, color=#2962FF, title="Upper", force_overlay=true)
plot(ma, color=#2962FF, title="Basis", force_overlay=true)
l = plot(lower, color=#2962FF, title="Lower", force_overlay=true)
fill(u, l, color=color.rgb(33, 150, 243, 95), title="Background")
//--Risk Management--// *-*-*-*-*-*-*-*-*-*-*-*-*-*-*-*-*-*-*-*-*-*-*-*-*-*-*-*-*-*-*-*-*-*-*-*-*-*-*-*-*-*-*-*-*-*-*-*-*-*-*-*-*-*-*-*-*-*-*-*-*-*-*-*-*-*-*-*-*-*-*-*-*-*-$$$$$$
riskPerTradePerc = input.float(1, title="Risk per trade (%)", group="Keltner Channel Breakout")
le = high>upper ? false : true
se = lowlower
strategy.entry('PivRevLE', strategy.long, comment = 'PivRevLE', stop = upper, qty=riskToLots)
if se and upper>lower
strategy.entry('PivRevSE', strategy.short, comment = 'PivRevSE', stop = lower, qty=riskToLots)
The tool will then use the strategy equity of your own strategy and use this to simulat prop firms. Since these CFD prop firms work with different phases and payouts the indicator will simulate the gains until target or max drawdown / daily drawdown limit gets reached. If it reaches target it will go to the next phase and keep on doing that until it fails a challenge.
If in one of the phases there is a reward for completing, like a payout, refund, extra it will add this to the gains.
If you fail the challenge by reaching max drawdown or daily drawdown limit it will substract the challenge fee from the gains.
These gains are then visualised in the calendar so you can get an idea of yearly / monthly gains of the backtest. Remember, it is just a backtest so no guarantees of future income.
The bottom pane (non-overlay) is visualising the performance of the backtest during the phases. This way u can check if it is realistic. For instance if it only takes 1 bar on chart to reach target you are probably risking more than the firm wants you to risk. Also, it becomes much less clear if daily drawdown got hit in those high risk strategies, the results will be less accurate.
The daily drawdown limit get's reset every time there is a new dayofweek on chart.
If you set your prop firm preset setting to "'custom" the settings below that are applied as your prop firm settings. Otherwise it will use one of the template by default it's FTMO 100K.
The strategy I'm using as an example in this script is a simple Keltner Channel breakout strategy. I'm using a 0.05% commission per trade as that is what I found most common on crypto exchanges and it's close to the commissions+spread you get on a cfd prop firm. I'm targeting a 1% risk per trade in the backtest to try and stay within prop firm boundaries of max 1% risk per trade.
Lastly, the original yearly and monthly performance table was developed by Quantnomad and I've build ontop of that code. Here's a link to the original publication:
That's everything for now, hope this indicator helps people visualise the potential of prop firms better or to understand that they are not a good fit for their current financial situation.
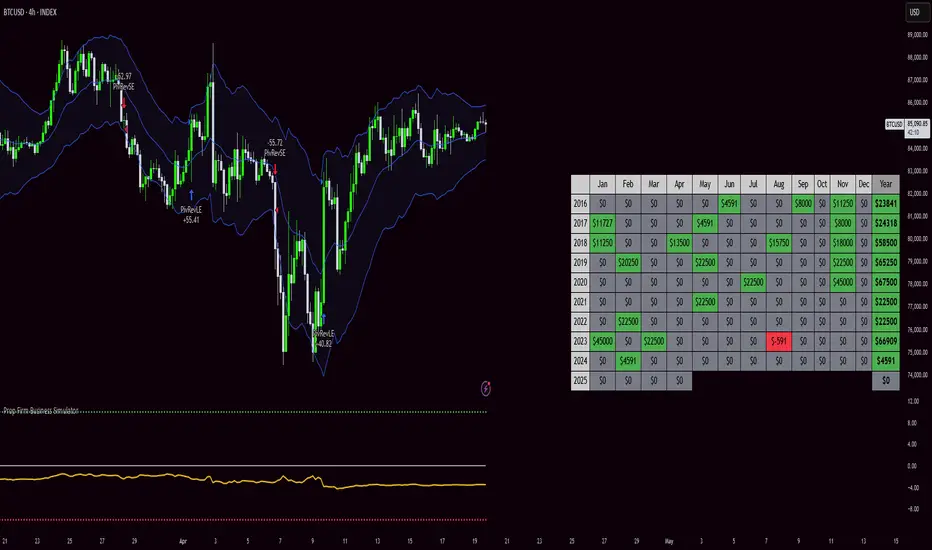
BTC Trading RobotOverview
This Pine Script strategy is designed for trading Bitcoin (BTC) by placing pending orders (BuyStop and SellStop) based on local price extremes. The script also implements a trailing stop mechanism to protect profits once a position becomes sufficiently profitable.
________________________________________
Inputs and Parameter Setup
1. Trading Profile:
o The strategy is set up specifically for BTC trading.
o The systemType input is set to 1, which means the strategy will calculate trade parameters using the BTC-specific inputs.
2. Common Trading Inputs:
o Risk Parameters: Although RiskPercent is defined, its actual use (e.g., for position sizing) isn’t implemented in this version.
o Trading Hours Filter:
SHInput and EHInput let you restrict trading to a specific hour range. If these are set (non-zero), orders will only be placed during the allowed hours.
3. BTC-Specific Inputs:
o Take Profit (TP) and Stop Loss (SL) Percentages:
TPasPctBTC and SLasPctBTC are used to determine the TP and SL levels as a percentage of the current price.
o Trailing Stop Parameters:
TSLasPctofTPBTC and TSLTgrasPctofTPBTC determine when and by how much a trailing stop is applied, again as percentages of the TP.
4. Other Parameters:
o BarsN is used to define the window (number of bars) over which the local high and low are calculated.
o OrderDistPoints acts as a buffer to prevent the entry orders from being triggered too early.
________________________________________
Trade Parameter Calculation
• Price Reference:
o The strategy uses the current closing price as the reference for calculations.
• Calculation of TP and SL Levels:
o If the systemType is set to BTC (value 1), then:
Take Profit Points (Tppoints) are calculated by multiplying the current price by TPasPctBTC.
Stop Loss Points (Slpoints) are calculated similarly using SLasPctBTC.
A buffer (OrderDistPoints) is set to half of the take profit points.
Trailing Stop Levels:
TslPoints is calculated as a fraction of the TP (using TSLTgrasPctofTPBTC).
TslTriggerPoints is similarly determined, which sets the profit level at which the trailing stop will start to activate.
________________________________________
Time Filtering
• Session Control:
o The current hour is compared against SHInput (start hour) and EHInput (end hour).
o If the current time falls outside the allowed window, the script will not place any new orders.
________________________________________
Entry Orders
• Local Price Extremes:
o The strategy calculates a local high and local low using a window of BarsN * 2 + 1 bars.
• Placing Stop Orders:
o BuyStop Order:
A long entry is triggered if the current price is less than the local high minus the order distance buffer.
The BuyStop order is set to trigger at the level of the local high.
o SellStop Order:
A short entry is triggered if the current price is greater than the local low plus the order distance buffer.
The SellStop order is set to trigger at the level of the local low.
Note: Orders are only placed if there is no current open position and if the session conditions are met.
________________________________________
Trailing Stop Logic
Once a position is open, the strategy monitors profit levels to protect gains:
• For Long Positions:
o The script calculates the profit as the difference between the current price and the average entry price.
o If this profit exceeds the TslTriggerPoints threshold, a trailing stop is applied by placing an exit order.
o The stop price is set at a distance below the current price, while a limit (profit target) is also defined.
• For Short Positions:
o The profit is calculated as the difference between the average entry price and the current price.
o A similar trailing stop exit is applied if the profit exceeds the trigger threshold.
________________________________________
Summary
In essence, this strategy works by:
• Defining entry levels based on recent local highs and lows.
• Placing pending stop orders to enter the market when those levels are breached.
• Filtering orders by time, ensuring trades are only taken during specified hours.
• Implementing a trailing stop mechanism to secure profits once the trade moves favorably.
This approach is designed to automate BTC trading based on price action and dynamic risk management, although further enhancements (like dynamic position sizing based on RiskPercent) could be added for a more complete risk management system.

Profit Trailing BBandsProfit Trailing Trend BBands v4.7.5 with Double Trailing SL
A TradingView Pine Script Strategy
Created by Kevin Bourn and refined with the help of Grok 3 (xAI)
Overview
Welcome to Profit Trailing Trend BBands v4.7.5, a dynamic trading strategy designed to ride trends and lock in profits with a unique double trailing stop-loss mechanism. Built for TradingView’s Pine Script v6, this strategy combines Bollinger Bands for trend detection with a smart trailing system that doubles down on profit protection. Whether you’re trading XRP or any other asset, this tool aims to maximize gains while keeping risk in check—all with a clean, visual interface.
What It Does
Identifies Trends: Uses Bollinger Bands to spot uptrends (price crossing above the upper band) and downtrends (price crossing below the lower band).
Enters Positions: Opens long or short trades based on trend signals, with customizable position sizing and leverage.
Trails Profits: Employs a two-stage trailing stop-loss:
Initial Trailing SL: Acts as a take-profit level, set as a percentage (%) or dollar ($) distance from the entry price.
Tightened Trailing SL: Once the initial profit target is hit, the stop-loss tightens to half the initial distance, locking in gains as the trend continues.
Manages Risk: Includes a margin call feature to exit losing positions before they blow up your account.
Visualizes Everything: Plots Bollinger Bands (blue upper, orange lower) and a red stepped trailing stop-loss line for easy tracking.
Why Built It?
Captures Trends: Bollinger Bands are a proven way to catch momentum, and we tuned them for responsiveness (short length, moderate multiplier).
Secures Profits: Traditional trailing stops often leave money on the table or exit too early. The double trailing SL first takes a chunk of profit, then tightens up to ride the rest of the move.
Stays Flexible: Traders can tweak price sources, stop-loss types (% or $), and position sizing to fit their style.
Looks Good: Clear visuals help you see the strategy in action without cluttering your chart.
Originally refined for XRP, it’s versatile enough for most markets — crypto, forex, stocks, you name it.
How It Works
Core Components
Bollinger Bands:
Calculated using a simple moving average (SMA) and standard deviation.
Default settings: 6-period length, 1.66 multiplier.
Upper Band (blue): SMA + (1.66 × StdDev).
Lower Band (orange): SMA - (1.66 × StdDev).
Trend signals: Price crossing above the upper band triggers a long, below the lower band triggers a short.
Double Trailing Stop-Loss:
Initial SL: Set via "Trailing Stop-Loss Value" (default 6% or $6). Trails the price at this distance and doubles as the first profit target.
Tightened SL: Once price hits the initial SL distance in profit (e.g., +6%), the SL tightens to half (e.g., 3%) and continues trailing, locking in gains.
Visualized as a red stepped line, only visible during active positions.
Position Sizing:
Choose "% of Equity" (default 30%) or "Amount in $" to set trade size.
Leverage (default 10x) amplifies positions, capped by available equity to avoid overexposure.
Margin Call:
Exits positions if drawdown exceeds the "Margin %" (default 10%) to protect your account.
Backtesting Filter:
Starts trading after a user-defined date (default: Jan 1, 2020) for focused historical analysis.
Trade Logic
Long Entry: Price crosses above the upper Bollinger Band → Closes any short position, opens a long.
Short Entry: Price crosses below the lower Bollinger Band → Closes any long position, opens a short.
Exit: Position closes when price hits the trailing stop-loss or triggers a margin call.
How to Use It
Setup
Add to TradingView:
Open TradingView, go to the Pine Editor, paste the script, and click "Add to Chart."
Ensure you’re using Pine Script v6 (the script includes @version=6).
Configure Inputs:
Start Date for Backtesting: Set the date to begin historical testing (default: Jan 1, 2020).
BB Length & Mult: Adjust Bollinger Band sensitivity (default: 6, 1.66).
BB Price Source: Choose the price for BBands (default: Close).
Trend Price Source: Choose the price for trend detection (default: Close).
Trailing Stop-Loss Type: Pick "%" or "$" (default: Trailing SL %).
Trailing Stop-Loss Value: Set the initial SL distance (default: 6).
Margin %: Define the max drawdown before exit (default: 10%).
Order Size Type & Value: Set position size as % of equity (default: 30%) or $ amount.
Leverage: Adjust leverage (default: 10x).
Run It:
Use the Strategy Tester tab to backtest on your chosen asset and timeframe.
Watch the chart for blue/orange Bollinger Bands and the red trailing SL line.
Tips for Traders
Timeframes: Works on any timeframe, but test 1H or 4H for XRP—great balance of signals and noise.
Assets: Optimized for XRP, but tweak slValue and mult for other markets (e.g., tighter SL for low-volatility pairs).
Risk Management: Keep marginPercent low (5-10%) for volatile assets; adjust leverage based on your risk tolerance.
Visuals: The red stepped SL line shows only during trades—zoom in to see its tightening in action.
Visuals on the Chart
Blue Line: Upper Bollinger Band (trend entry for longs).
Orange Line: Lower Bollinger Band (trend entry for shorts).
Red Stepped Line: Trailing Stop-Loss (shifts tighter after the first profit target).
Order Labels: Short tags like "OL" (Open Long), "CS" (Close Short), "LSL" (Long Stop-Loss), etc., mark trades.
Disclaimer
Trading involves risk. This strategy is for educational and experimental use—backtest thoroughly and use at your own risk. Past performance doesn’t guarantee future results. Not financial advice—just a tool from traders, for traders.

Non-Repainting Renko Emulation Strategy [PineIndicators]Introduction: The Repainting Problem in Renko Strategies
Renko charts are widely used in technical analysis for their ability to filter out market noise and emphasize price trends. Unlike traditional candlestick charts, which are based on fixed time intervals, Renko charts construct bricks only when price moves by a predefined amount. This makes them useful for trend identification while reducing small fluctuations.
However, Renko-based trading strategies often fail in live trading due to a fundamental issue: repainting .
Why Do Renko Strategies Repaint?
Most trading platforms, including TradingView, generate Renko charts retrospectively based on historical price data. This leads to the following issues:
Renko bricks can change or disappear when new data arrives.
Backtesting results do not reflect real market conditions. Strategies may appear highly profitable in backtests because historical data is recalculated with hindsight.
Live trading produces different results than backtesting. Traders cannot know in advance whether a new Renko brick will form until price moves far enough.
Objective of the Renko Emulator
This script simulates Renko behavior on a standard time-based chart without repainting. Instead of using TradingView’s built-in Renko charting, which recalculates past bricks, this approach ensures that once a Renko brick is formed, it remains unchanged .
Key benefits:
No past bricks are recalculated or removed.
Trading strategies can execute reliably without false signals.
Renko-based logic can be applied on a time-based chart.
How the Renko Emulator Works
1. Parameter Configuration & Initialization
The script defines key user inputs and variables:
brickSize : Defines the Renko brick size in price points, adjustable by the user.
renkoPrice : Stores the closing price of the last completed Renko brick.
prevRenkoPrice : Stores the price level of the previous Renko brick.
brickDir : Tracks the direction of Renko bricks (1 = up, -1 = down).
newBrick : A boolean flag that indicates whether a new Renko brick has been formed.
brickStart : Stores the bar index at which the current Renko brick started.
2. Identifying Renko Brick Formation Without Repainting
To ensure that the strategy does not repaint, Renko calculations are performed only on confirmed bars.
The script calculates the difference between the current price and the last Renko brick level.
If the absolute price difference meets or exceeds the brick size, a new Renko brick is formed.
The new Renko price level is updated based on the number of bricks that would fit within the price movement.
The direction (brickDir) is updated , and a flag ( newBrick ) is set to indicate that a new brick has been formed.
3. Visualizing Renko Bricks on a Time-Based Chart
Since TradingView does not support live Renko charts without repainting, the script uses graphical elements to draw Renko-style bricks on a standard chart.
Each time a new Renko brick forms, a colored rectangle (box) is drawn:
Green boxes → Represent bullish Renko bricks.
Red boxes → Represent bearish Renko bricks.
This allows traders to see Renko-like formations on a time-based chart, while ensuring that past bricks do not change.
Trading Strategy Implementation
Since the Renko emulator provides a stable price structure, it is possible to apply a consistent trading strategy that would otherwise fail on a traditional Renko chart.
1. Entry Conditions
A long trade is entered when:
The previous Renko brick was bearish .
The new Renko brick confirms an upward trend .
There is no existing long position .
A short trade is entered when:
The previous Renko brick was bullish .
The new Renko brick confirms a downward trend .
There is no existing short position .
2. Exit Conditions
Trades are closed when a trend reversal is detected:
Long trades are closed when a new bearish brick forms.
Short trades are closed when a new bullish brick forms.
Key Characteristics of This Approach
1. No Historical Recalculation
Once a Renko brick forms, it remains fixed and does not change.
Past price action does not shift based on future data.
2. Trading Strategies Operate Consistently
Since the Renko structure is stable, strategies can execute without unexpected changes in signals.
Live trading results align more closely with backtesting performance.
3. Allows Renko Analysis Without Switching Chart Types
Traders can apply Renko logic without leaving a standard time-based chart.
This enables integration with indicators that normally cannot be used on traditional Renko charts.
Considerations When Using This Strategy
Trade execution may be delayed compared to standard Renko charts. Since new bricks are only confirmed on closed bars, entries may occur slightly later.
Brick size selection is important. A smaller brickSize results in more frequent trades, while a larger brickSize reduces signals.
Conclusion
This Renko Emulation Strategy provides a method for using Renko-based trading strategies on a time-based chart without repainting. By ensuring that bricks do not change once formed, it allows traders to use stable Renko logic while avoiding the issues associated with traditional Renko charts.
This approach enables accurate backtesting and reliable live execution, making it suitable for trend-following and swing trading strategies that rely on Renko price action.

Bollinger Bands by Abu ElyasBollinger Bands with Adjustable Stop Loss (Long-Only)
This strategy uses a Bollinger Band breakout approach to enter long positions and incorporates an adjustable stop loss for risk management.
Below is an overview of the logic, parameters, and usage instructions.
1. Bollinger Bands Logic
Basis (Middle Band): A moving average (type selectable by the user) of the chosen source, typically the closing price.
Upper Band: The basis plus a specified number of standard deviations (user-defined multiplier).
Lower Band: The basis minus the same number of standard deviations.
2. Entry Triggers
The strategy enters a long position when the close price rises above the upper Bollinger Band , suggesting a potential bullish breakout.
This logic is only applied within a user-specified date range (adjustable in the strategy’s inputs).
3. Exit Triggers
1. Bollinger Band Exit:
If the close price drops below the lower Bollinger Band , the strategy closes the position, indicating a loss of bullish momentum.
2. Stop Loss Exit:
A default 8% stop loss is set, which automatically exits the trade if the close falls 8% below the entry price.
This stop-loss percentage is adjustable from the strategy’s settings, allowing users to tailor risk based on their preferences.
3. Date Range:
If the current bar is outside of the specified start/end dates, the strategy will also exit any open positions.
4. Position Sizing & Other Settings
1- Position Size:
By default, the script uses 100% of account equity for each trade.
2- Commissions & Slippage:
Commission is set to 0%, and slippage is set to 3 ticks.
3- Timeframe Handling:
You can select a custom timeframe or leave it blank to use the chart’s timeframe.
5. Customization
1. Bollinger Bands Parameters:
Length of the moving average, type of moving average (SMA, EMA, etc.), and the standard deviation multiplier can be adjusted.
2. Stop Loss (%)
The default stop loss of 8% can be changed in the script’s input settings to any percentage you prefer.
3. Date Filter:
Modify the start/end dates to control the historical period over which the strategy executes trades.
6. Notes & Best Practices
1- No Short Trades:
This is a long‐only strategy. It will either be in a long position or flat (no open position).
2- Risk Management:
An 8% stop loss may or may not align with your personal risk tolerance. Always adjust according to market conditions and your own trading style.
3- Market Gaps & Volatility:
In highly volatile markets, slippage or gaps can cause the actual exit price to be worse than the intended stop-loss level.
4- Test Thoroughly:
Backtest on different timeframes and market conditions. No single strategy works in all scenarios.
7. Disclaimer
Educational Use Only: This script is for informational and illustrative purposes and should not be considered financial advice.
No Guarantee of Profit: Past performance does not guarantee future results. Trading involves substantial risk, and it is possible to lose more than your initial investment.
Consult a Professional: Always consult a qualified financial advisor before making investment decisions.
Use this script as a foundation and personalize it based on your trading style, tolerance for drawdowns, and market conditions.

FVG Breakout Lite by tradingbauhausExplanation of "FVG Breakout Lite by tradingbauhaus"
This script is a trading strategy built for TradingView that helps you spot and trade "Fair Value Gaps" (FVGs)—price areas where the market moved quickly, leaving a gap that might act as support or resistance later. It’s designed to catch breakout opportunities when the price moves strongly in one direction, with extra filters to make trades more reliable. Here’s how it works and how you can use it:
What It Does
1. Finds Fair Value Gaps (FVGs):
A "Bullish FVG" happens when the price jumps up quickly, leaving a gap below where it didn’t trade much (e.g., today’s low is higher than the high from two bars ago).
A "Bearish FVG" is the opposite: the price drops fast, leaving a gap above (e.g., today’s high is lower than the low from two bars ago).
The script draws colored boxes on your chart to show these gaps: green for bullish, red for bearish.
2. Spots Breakouts:
It looks for "strong" FVGs by comparing them to a trend (based on the highest highs and lowest lows over a set period).
If a bullish gap forms above the recent highs, or a bearish gap below the recent lows, it’s marked as a breakout opportunity.
3. Adds a Volume Check:
Trades only happen if the market’s volume is higher than usual (e.g., 1.2x the average volume over the last 20 bars). This helps ensure the breakout has real momentum behind it.
4. Trades Automatically:
Long Trades (Buy): If a bullish breakout FVG forms and volume is high, it buys at the current price.
Short Trades (Sell): If a bearish breakout FVG forms with high volume, it sells short.
Each trade comes with a stop loss (to limit losses) and a take profit (to lock in gains), both adjustable by you.
5. Shows Mitigation Lines (Optional):
If you turn on "Display Mitigation Zones," it draws lines at the edge of each breakout FVG. These lines show where the price might return to "fill" the gap later, helping you see key levels.
6. Includes Webull Costs:
The script factors in real trading fees from Webull, like tiny SEC and FINRA fees for selling, and a daily margin cost if you’re borrowing money to trade. These don’t show up on the chart but affect the strategy’s performance in backtesting.
How to Use It
1. Add to Your Chart:
Copy the script into TradingView’s Pine Editor, click "Add to Chart," and it’ll start drawing FVGs and running the strategy.
2. Customize Settings:
Trend Period (Default: 25): How many bars it looks back to define the trend. Longer periods mean fewer but stronger signals.
Volume Lookback (Default: 20) & Volume Threshold (Default: 1.2): Adjust how it measures "high volume." Increase the threshold for stricter trades.
Stop Loss % (Default: 1.5%) & Take Profit % (Default: 3%): Set how much you’re willing to lose or aim to gain per trade.
Margin Rate % (Default: 8.74%): Webull’s rate for borrowing money—lower it if your account qualifies for a better rate.
Display Mitigation Zones (Default: On): Toggle this to see or hide the gap lines.
Colors: Change the green (bullish) and red (bearish) shades to suit your chart.
3. Backtest It:
Go to the "Strategy Tester" tab in TradingView to see how it performs on past data. It’ll show trades, profits, losses, and Webull fees included.
4. Watch It Work:
Green boxes mean bullish FVGs; red boxes mean bearish FVGs. If volume spikes and the price breaks out, you’ll see trades happen automatically.
What to Expect
Visuals: You’ll see colored boxes for FVGs and optional lines showing where they start. These help you spot key price zones even if you’re not trading.
Trades: It’s selective—only trades when FVGs align with a breakout and volume confirms it. Expect fewer trades but with higher potential.
Risk: The stop loss keeps losses in check, while the take profit aims for a 2:1 reward-to-risk ratio by default (3% gain vs. 1.5% loss).
Costs: Webull’s fees are small but baked into the results, so you’re seeing a realistic picture of profits.
Tips for Users
Test it on a small timeframe (like 5-minute charts) for day trading or a larger one (like daily) for swing trading.
Play with the volume threshold—if you get too few trades, lower it (e.g., 1.1); if too many, raise it (e.g., 1.5).
Watch how price reacts to the mitigation lines—they’re often support or resistance zones traders target.
This strategy is lightweight, focused, and built for traders who like breakouts with a bit of confirmation. It’s not foolproof (no strategy is!), but it gives you a clear way to trade FVGs with some smart filters.
